kentik Product Updates logo
Back to Homepage Subscribe to Updates

Product Updates

Latest features, improvements, and product updates on Kentik's Network Observability platform.

Labels

  • All Posts
  • Improvement
  • Hybrid Cloud
  • Core
  • Service Provider
  • UI/UX
  • Synthetics
  • Insights & Alerting
  • DDoS
  • New feature
  • BGP Monitoring
  • MyKentik Portal
  • Agents & Binaries
  • Kentik Map
  • API
  • BETA
  • Flow
  • SNMP
  • NMS
  • AI

Jump to Month

  • April 2025
  • March 2025
  • February 2025
  • January 2025
  • December 2024
  • November 2024
  • October 2024
  • August 2024
  • July 2024
  • June 2024
  • May 2024
  • April 2024
  • March 2024
  • February 2024
  • January 2024
  • December 2023
  • November 2023
  • October 2023
  • September 2023
  • August 2023
  • July 2023
  • June 2023
  • May 2023
  • April 2023
  • March 2023
  • February 2023
  • January 2023
  • December 2022
  • November 2022
  • October 2022
  • September 2022
  • August 2022
  • July 2022
  • June 2022
  • May 2022
  • April 2022
  • March 2022
  • February 2022
  • December 2021
  • November 2021
  • October 2021
  • September 2021
  • July 2021
  • June 2021
  • May 2021
  • March 2021
  • February 2021
  • January 2021
  • December 2020
  • October 2020
  • September 2020
  • June 2020
  • February 2020
  • August 2019
  • June 2019
  • April 2019
  • March 2019
  • February 2019
  • January 2019
  • December 2018
  • November 2018
  • September 2018
  • August 2018
  • June 2018
  • May 2018
  • April 2018
  • March 2018
  • February 2018
  • January 2018
  • December 2017
  • November 2017
  • October 2017
  • July 2017
  • June 2017
  • May 2017
  • April 2017
  • March 2017
  • February 2017
  • January 2017
  • December 2016
  • November 2016
  • October 2016
  • April 2016
ImprovementSynthetics
4 years ago

Synthetic Monitoring: Mesh Visualizations

A Better Look at Network Observability

With the rapid development of cloud networking, some traditional ways of visualizing the network are under strain. It’s getting difficult to see where problems arise and drill into them on network maps designed around old low-density, device-based topologies. To make networks more observable, Kentik has been hard at work on a new visualization, optimized for emerging high-density, hybrid- and multi-cloud networks.


Meet Kentik’s “Mesh” Visualization

A mesh visualization is what it sounds like: a mesh or a matrix of network tests and traffic representing all possible connections between a set of test-points and end-points. Each “cell” in the mesh provides data on test results, traffic, or health status. Like looking at a spreadsheet, you can quickly associate any cell with the network endpoints by looking at the row and column headings. Using this visualization, you can get a lot of information into a single view and make that intuitive.

Kentik’s unique mesh visualization provides a global view and allows you to drill into details by hovering over or clicking individual cells

This month, Kentik is introducing important new features to the mesh visualization. Here’s a summary of the top new items:

  • Better support for very large meshes with scroll bars and performance enhancements
  • Easier-to-read headings or names on the “rows” and “columns”
  • A clearer depiction of the time-range
  • Improved presentation of data when hovering over individual cells
  • Ability to clone a mesh to get a good starting point for customizations

Even Better Together with Flow Data

The mesh test results make it easy to see when there’s a problem, but your next thought goes to “is there any impact on traffic?” The last thing you want to do at this point is jump over to another tool to get the answer. Now Kentik makes it easy to see real traffic time-series charts alongside synthetics metrics in the test details by leveraging the site IP configuration information.

See synthetic test results side-by-side in sync with time-series traffic data


Use Cases

There are many ways to use Kentik’s mesh tests in practice. Here are a couple of common use cases:

  • Migrate to or Between Clouds with Confidence

With the new mesh test compare network performance of applications or services running in the cloud versus in data centers or between different cloud regions and availability zones so as to determine the best migration strategy.

  • Monitor DC-to-DC or Intra-DC Connectivity

Create complex bi-directional site-mesh tests to test connectivity between data centers or within points of a data center easily, and view results holistically.

In Summary

As cloud networking adoption grows, we need new innovative ways to visualize network test results and understand performance metrics in terms of real traffic data. Answering any question about the network means intuitive visualizations and the ability to look at and correlate network telemetry data quickly. Kentik is leading the charge with the new mesh test view and the integration of real traffic information.

For more detailed information about this and many other recent Kentik product improvements, see our February product update.

Avatar of authorChristoph Pfister
Insights & AlertingDDoS
4 years ago

DDoS Mitigation: February 2021 Update

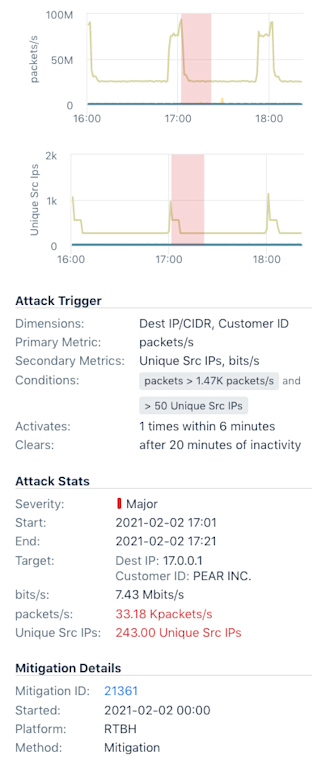
Kentik DDoS detection leverages network analytics and insights to deliver a detailed picture of your traffic, serving to identify and mitigate DDoS attacks in real time. This service protects organizations’ networks and ensures business continuity.

We’ve made a number of improvements to v4 DDoS detection and policies, see for yourself:


  • The mitigation list in v4 now shows all mitigations, regardless of whether they were triggered by v3 or v4 policies.
  • Mitigation list now includes the mitigation ID.
  • Alerts and mitigations are now cross-referenced. Alert summaries and details show any related mitigations and vice versa.


  • Configured thresholds are now displayed immediately in the policy configuration. Previously, thresholds were displayed only after the graph finished loading.
  • Thresholds must now be configured in order (i.e. “critical” must have higher threshold values than “major”).
  • Threshold lines on the graph now use colors with more contrast to make them easier to distinguish.
  • General cleanup and bug fixes in policy configuration, including IP exclusions
  • DDoS alert log is now searchable by multiple dimensions, including full or partial key values.


Avatar of authorJoe Reves
ImprovementInsights & Alerting
4 years ago

Insights: February 2021 Update

Insights are a unique feature provided by Kentik. They are autonomous notices that tell you about interesting or anomalous behaviors. Insights can be any fact that is relevant to the traffic at which you are looking. Insights help you quickly recognize where there might be a problem that requires your attention.
This February 2021, we're making Kentik Insights even more powerful.


New Comparison Insights

We are releasing a number of new comparison insights for Cloud, Edge, and Service Provider dimensions. These have been introduced in conjunction with the comparison threshold improvements (explained below). Please also see the Knowledge Base documentation.

Edge Traffic Comparison

InsightSummary
Through Destination ASN ComparisonWeek-over-week changes to the volume and/or ranking of the top 10 destination ASNs of the traffic through the edge of your infrastructure.
Through Source ASN ComparisonWeek-over-week changes to the volume and/or ranking of the top 10 source ASNs of the traffic through the edge of your infrastructure.

Cloud Traffic Comparison

InsightSummary
Outbound Cloud Service ComparisonWeek-over-week changes to the volume and/or ranking of the top 10 cloud service traffic outbound from your onprem infrastructure.
Inbound Cloud Service ComparisonWeek-over-week changes to the volume and/or ranking of the top 10 cloud service traffic inbound to your onprem infrastructure.
Multi-Cloud ComparisonWeek-over-week changes to the volume and/or ranking of the top 10 cloud provider traffic to and from your cloud infrastructure.
AWS Region to On-Prem ComparisonWeek-over-week changes to the volume and/or ranking of the top 10 AWS Region traffic inbound to your onprem infrastructure.
Inbound AWS Region ComparisonWeek-over-week changes to the volume and/or ranking of the top 10 AWS Region traffic inbound to your AWS infrastructure.
On-Prem to AWS Region ComparisonWeek-over-week changes to the volume and/or ranking of the top 10 AWS Region traffic outbound to your onprem infrastructure.
Outbound AWS Region ComparisonWeek-over-week changes to the volume and/or ranking of the top 10 AWS Region traffic outbound to your AWS infrastructure.
Hybrid Cloud ComparisonWeek-over-week changes to the volume and/or ranking of the top 10 AWS Region and AWS Subnet traffic outbound to your AWS infrastructure.
Internal AWS Region to Region ComparisonWeek-over-week changes to the volume and/or ranking of the top 10 AWS Region Pairs traffic outbound to your AWS infrastructure.
Hybrid Cloud Application ComparisonWeek-over-week changes to the volume and/or ranking of the top 10 application traffic to and from your onprem infrastructure.

Service Provider Analytics Traffic Comparison

InsightSummary
OTT Type ComparisonWeek-over-week changes to the volume and/or ranking of the top 10 OTT service category (Video, Gaming...) traffic entering your network.
OTT Service ComparisonWeek-over-week changes to the volume and/or ranking of the top 10 OTT service traffic entering your network.
Avatar of authorJoe Reves
ImprovementSynthetics
4 years ago

Synthetic Monitoring: the February 2021 update

With February 2021 comes another heavy load of new Synthetic Monitoring feature additions: Synthetics Dashboard Widgets, more functionality for Mesh tests, we're now surfacing related Network Flow data within Synthetic test results, as well as many more general point improvements. See for yourself.


Dashboard Widgets and My Kentik Portal Support

Kentik customers now have the option of adding synthetics test results as widgets to their Kentik dashboards and then sharing those widgets with their customers (tenants) via My Kentik Portal. Custom dashboards also let you visualize real traffic charts alongside synthetic test results to help you easily correlate test failures with changes in real traffic patterns.

  • Editing any existing dashboard will show users an option to add “Synthetic Test View.”
  • Clicking Add will show a modal that allows users to select a synthetic test from the list of tests configured in the account.
  • If the selected test happens to be a mesh test, the user has the option of choosing to have the widget either show a mesh or a table of results.

High Density Meshes and Mesh Improvements

The mesh tests are a very popular feature and we continue to respond to the most common UX enhancement requests. We’ve made the following improvements:

  • For very large meshes, we’ve added dynamic horizontal and vertical scrollbars when the mesh gets beyond a certain size.
  • For “Network Performance Meshes” shown in the Synthetics Performance Dashboard, a label has been added to clearly indicate the 15-minute range. Clicking the link propagates the 15-minute time range so that the test results page shows the same results as the performance dashboard.
  • The “Customize” button has been renamed to “Show/Hide” for clarity
  • We increased the string length for labels on the left and top edges of the meshes that represented sites to allow the strings to be longer and wrap across multiple lines so as to let users determine which paths/routes are failing with a quick glance of the mesh.
  • Hovering over the individual cells of a mesh would show location information as city, state, country, which is not easily actionable when testing between public cloud regions or private sites. This is now enhanced with both pieces of information.

  • The Cloud Performance preset meshes are well-received. We improved the UX around parsing their information as well as customization:
    • We added the ability to easily clone them (like the SaaS applications), which allows customers to customize them to make a "yybrid-cloud" mesh out of it for their own specific network performance needs.
    • We also show cloud regions in addition to geo (city/state) information in the labels to the left and the top.

Flow Data in Mesh Test Results

Showing real traffic time-series charts alongside synthetics metrics in the test details is an important feature, but this wasn’t possible to do for site-to-site tests (like agent-to-agent tests or mesh tests) because there was no IP to query based on. We solved this by leveraging the new site-IP configuration that was added to the device configuration. If a site-IP is present it will be used to build the traffic chart and allow the user to jump into Data Explorer to slice and dice the data further.

General Improvements

Several general improvements to the UX have been made in response to customer feedback:

  • The workflow to find a failing sub-test’s details (the time-series charts) is simplified by making the agent dots on the map clickable. Clicking them now takes you to the test details:

  • Defining and assigning a notification channel in the test creation screen is much more intuitive than it was before:

  • It wasn’t clear to users that it takes a while (up to a day) for IP changes to reflect. We added a tooltip for this:

  • The point where the day changed on the test timeline was not clear — this is improved visually. Also, the date format shown in the selector now matches the format of the date shown on the timeline:

  • The agent version for customer’s private agents is now visible to them. Also, checking a customer’s private agents’ IPs and versions is simplified — the agents’ information is readily available in the table:

  • Paused tests now show in historical data.
  • Test results legend previously said “ICMP could be blocked.” This has been generalized, as the test could be TCP or UDP.

Avatar of authorSunil Kodiyan
ImprovementSyntheticsInsights & AlertingDDoS
4 years ago

February 2021 feature update summary

Synthetics

Kentik’s product and engineering teams continued rapid iteration on Kentik Synthetics. The mesh test display has been greatly enhanced to handle large meshes, and synthetics widgets are now available for dashboards and My Kentik Portal. Flow-based traffic data has also been added to mesh test results. This builds on Kentik’s unique combination of synthetics and real traffic information to help our customers easily choose and set up the right tests.

New Insights

We’ve also added a number of new traffic comparison insights looking for traffic volume changes, changes in volume for cloud services and regions, and changes in OTT dynamics.

Alerting, DDoS & Mitigation

On the DDoS front, we’ve delivered a number of improvements requested by customers. Some are focused on better visibility into mitigation actions and others on usability improvements for policy configuration and alert history.

Avatar of authorJosh Jensen
CoreAgents & Binaries
4 years ago

Kproxy Enhancements

This January, we introduce the 1st round towards a better way to manage your fleet of kproxy agents.
You can deploy kproxy agents to secure the network telemetry data between your own devices and Kentik's public Flow/SNMP/BGP ingest front-doors, configuring your routing gear to ship this data to a kproxy instance in your network, which will relay the resulting multiplex securely to Kentik's SaaS Clusters.
More information about kproxy here in our knowledge base.


Kproxy is now a first-class citizen in the portal, i.e. it comes with its own Settings screen. This screen comes with the following elements:

  • Ability to name and locate your agents in sites that you've configured for other routing devices, and set flow listening IP (mostly useful for config snippets)
  • A new onboarding path that will let users deploy a kproxy instance in the first touch experience as a first step in the flow-generating device provisioning first touch onboarding flow.

    • The onboarding flow, as well as the modal from the Flow Proxy Agent screen in Settings now displays updated instructions to deploy kproxy both in an ad-hoc manner as well as using the industry-standard systemd service manager.
  • The updated deployment method for kproxy now alleviates the need for user-specific API credentials to launch a kproxy instance. Company-global credentials are provided in the instructions, whether in onboarding or on the kproxy settings screen.
  • Multiple screens in the existing Kentik UI have been updated to reflect a flow device’s dependency on kproxy as follows:
    • The Network Explorer Device Details page, in the “More Info” section
    • The Settings > Device page with its device details drawer

Note that existing kproxy-based users will see their kproxies show up in the UI without the site, name and IP metadata associated with them. These can freely be updated as suggested by the UI.

Avatar of authorGreg Villain
ImprovementSynthetics
4 years ago

Synthetics: January 2021 Update

Our Synthetic Monitoring product gets another delivery of features in January 2021: Kentik is now monitoring performance within the most popular Public Clouds, per-user granular permissions are now available for Viewing and Editing synthetic tests, and Private Agents now come with labels, so you can manage them more efficiently.


Free Cloud Performance Meshes

There’s a tab for that!

Do you have applications deployed in multiple availability zones of a given cloud provider? How about across different cloud providers? We heard our customers say things like, “I want to know if users on the east coast are seeing problems loading my app because the latency to us-east-1 has increased significantly” or “How can I be sure that my app instance in EC2 is able to reach my BigQuery instance in GCP?” and we realized that not only can we provide a real quick way of answering that question, but we could go a step further and make that answer available to all our customers for free (exactly the way we did with the Free SaaS application performance tab). Say Hello to the new Cloud Performance Mesh tab!

The new Cloud Performance tab gives users a general sense of cloud performance without them having to create these test themselves and needing to use test credits.

We have four preconfigured tests — one each for testing performance between different regions of the three biggest cloud providers (AWS, Azure and GCP) and one for testing performance between them.

We hope you find these cloud performance meshes useful. Based on the feedback we receive, we will consider adding similar (preconfigured/ free) meshes for other cloud providers.

Trace Text Output

"Sometimes I just want to see a list of all the IPs, good old traceroute style!"
– Kentik customer

Kentik Synthetics users love the path view, and they tell us that it helps them find issues in their network that they were blind to before. Given the high adoption of this feature, we are especially attentive to user feedback. One of the things we heard was, “I love being able to see all the nodes and links, but sometimes I just want to see a list of all the IPs, good old traceroute style!” And so we made that happen!

Clicking on any agent in the path view will pop out a pane on the right (you may recall this new pane from our December update) that will show you the text trace output from that agent to each destination in individual text boxes.

Path View “De-noising”

Another point of feedback on the path view was that, while it is very rich in data and in its ability to crunch through that data, the view can get very busy and hard to parse when there are a lot of nodes, and it can become like trying to find a “needle in a haystack.”

To help “de-noise” things, we had (and still have) a way to “collapse all ASNs,” but that was an “all or nothing.” So, now we have improved on that — we are offering customers a way to peel off node layers selectively from either side. Unlike competitive solutions, we can collapse each layer of nodes down to the ASNs and highlight any problems in an aggregated fashion. So, if you collapse a set of nodes and one of them happens to have high loss, you’ll still retain the information about it by looking at the color of the ASN that contains it (turning red).

User Level Permissions

To increase RBAC for Synthetics, we have built per-user overrides, putting control in the super-administrators’ hands. Super-administrators can selectively restrict test viewing privileges to administrators. We also added similar options for being able only to view but not add or change agents.

Agent and Test Labels

Kentik Synthetics now supports being able to tag both agents as well as tests with Labels. A global set of labels can be defined and used across all agents and tests, and existing or new (flow) device labels can also be applied. This feature is currently in limited availability, so if you are interested in checking it out, please reach out via your account team.

Users can now define any number of custom labels and tag them to agents (both private and global/ public). Doing so makes it easy to select groups of agents when creating tests, thereby reducing the time needed to set up tests in addition to reducing errors and maintaining consistency of testing.

Tests can also be tagged with labels, similar to the way agents can. Once tagged, it is easy to organize and sort through the list of tests using the labels filter.


Avatar of authorSunil Kodiyan
ImprovementCore
4 years ago

New Interfaces Management Capabilities

Interface Classification is one of the pillars behind an optimally efficient use of Kentik for Network Observability: it helps our underlying query engine understand what enters, leaves, goes through your network. Via Connectivity Type classifications, it brings business color into your flow data. While programmatic interface classification based on SNMP data is achieved by our Interface Classification engine, we realize that not all of your interfaces always come with consistent descriptions. To solve this problem we're introducing this January a whole lot of additional Interface Management capabilities to help you take classification to 100%.


Interface IP Address Overrides

We are now supporting the capability of overriding an interface’s IP address. This override works in the same way the other interface overrides work. Here are some example scenarios:

  • The ability to set IP addresses for platforms that do not support obtaining the IP addresses of interfaces from SNMP
  • The ability to remove the IP address that is obtained from SNMP
  • The ability to set the IP address regardless of what SNMP provides

Static Interface Classification

Users are now able to statically classify interfaces from multiple areas in the product. This feature provides a good way for companies with loosely-enforced interface naming conventions to be able to correctly classify their traffic. This feature allows users to benefit from the full breadth of Network Explorer and all modules relying on Interface Classification.

Important: Interface Classification attributes (Network Boundary, Connectivity Type, Provider) defined statically per-interface will always supersede dynamic rules defined in the Interface Classification engine. As a result, the dynamic interface classification UI will also show when such static definitions are set.

The rules evaluation UI has also changed so that statically classified interfaces appear as such when they escape dynamic rules, as they always supersede them. An orange checkmark will indicate that an interface is statically classified, as displayed in the screenshot below:

From the Settings > Manage Interfaces Screen

Multiple interfaces can be selected and bulk-configured from the top-right Classify dropdown, and users can also access a more complete Interface Attributes config screen from the edit icon button at the end of each interface’s row.

The interface screen’s right-side filter section will assist the user in identifying unclassified interfaces, statically classified interfaces making the manual classification process easier.

Additionally, this panel will also assist users in identifying interfaces that have been statically classified, offering the selectors displayed in this screenshot, prefixed with the “Overridden” mention.

Lastly, users will also be able to reset an interface’s static configuration from the single interface configuration screen, as depicted below, by hitting the “Restore” link:

From Any Network Explorer > Interface Detail Screen

As shown in the screenshot below:


If you'd like to learn more about Interface Classification in Kentik, the best place to start is this knowledge base article.

Avatar of authorGreg Villain
ImprovementCoreAgents & Binaries
4 years ago

Kproxy Custom DNS Option

In lieu of using Kentik’s on-the-fly reverse DNS, customers can leverage kproxy and have it query their own DNS and insert rDNS values into the Kflow data. Among other things, it allows resolution of private IPs reverse DNS, but the initial tradeoff was that it cost customers two of their own custom dimensions. Upon rollout of this feature, native Kentik dimensions will be used.

How can I use this feature?
The following Knowledge Base Article will help you configure kproxy to perform this task.

Avatar of authorGreg Villain
CoreNew featureMyKentik Portal
4 years ago

My Kentik Portal gets a complete v4 overhaul !


My Kentik Portal (MKP) is a multi-tenant white-label network observability service that enables Kentik’s customers to market network analytics on top of their existing services. MKP is flexible and easy to use. MKP analytics data can be customized to serve customers’ unique requirements.

What’s New with MKP?

My Kentik Portal has been ported to v4. In addition to everything available in v3, the new v4-based MKP comes with a new and streamlined landlord and tenant UI. Also, v3 was only available to Kentik Premier customers. With v4, we are now making MKP available to all customers (Classic, Pro, Premier).

Read Greg Villain's full announcement in this blog post.


A few noteworthy improvements brought with the v4 version include:

Introduction of Packages & Brandable Tenant Templates

While in practice the templates work the same, landlords now have the ability to brand them. The “Packages” tab will show the adoption of these packages across tenants.

An Overhauled View Assignment UX

Landlords can now see all the views assigned to a tenant at configuration time, whether assigned ad-hoc or as part of a template.

Options for Simpler and Safer Tenant Configuration

Tenant configuration now includes the ability to view the resulting filter as well as a direct option on all dashboards to “Preview as a Tenant.” This will append a clearly identifiable (named) filter group to the current dashboard filtering options and mimic what the target tenant will see.

Redesigned Tenant Portal UX

The redesigned tenant portal takes advantage of the screen’s real estate to display all of the analytics and alerting information at a glance. The improvements also allow for Guided Dashboard parameters to be entered directly from the landing page.


Avatar of authorGreg Villain