
Kentik v4: Big Winter Launch Summary
For the last few months, our product team has been adding exciting, new capabilities that transform Kentik from a network monitoring product into an AIOps platform — turning data into insights and using automation to empower network teams.
Here is the complete product update on all new major features that were released between August 2019 and February 2020. We’ll also talk about what’s next on our near-term roadmap. Let’s dig in.
Overview
Running networks has never been easy, especially today. As digital business drives the fastest revenue growth in history, infrastructure/Ops teams are under tremendous pressure to run networks smoothly. However, since even small networks continuously generate gigabytes of diagnostic and telemetry data, operators spend hours collecting, collating, merging and analyzing this information to understand network utilization, manage and optimize network capacity, troubleshoot problems, identify malicious actors, and manage costs.
At Kentik, we want to make managing networks significantly easier. We have done that in this release by:
- Providing use case-specific workflows that are designed to help users address complicated, error-prone tasks quickly and easily
- Equipping users with proactive insights that are both automatically generated and user-defined
- Providing convenient, interactive and fast access to your most frequently used views easily
- Adding a highly intuitive Network Map to help users oversee the entire infrastructure
Workflows and Modules At-a-glance
At a high level, workflows focus on common Ops tasks and are categorized into four different modules (Operate, Edge, Protect, Service Provider). There are also some shared core components that are used across multiple workflows, such as Insights & Alerting, Data Explorer, and Network Map.
OPERATE
Troubleshoot and visualize network traffic and infrastructure across cloud, data center, WAN and campus environments.
- Centralize visibility and control of your entire network footprint
- Answer any network question quickly and easily
- Reduce MTTR and improve team efficiency with guided workflows
Network Explorer:
|
Insights & Alerting:
|
Data Explorer:
|
Network Map:
|
Capacity Planning:
|
EDGE
Analyze and optimize network performance and costs across the internet edge.
- Manage interconnection with other networks to optimize traffic paths for cost or performance
- Project network costs and verify provider invoices against measured traffic volumes
- Ensure infrastructure reliability for internet-facing applications and services
Peering & Interconnection:
|
Connectivity Costs:
|
Traffic Engineering:
|
PROTECT
Protect the network from DDoS attacks with fast, accurate detection, automated mitigation actions, and fine-grained forensics.
- Eliminate midnight wake-ups with automated DDoS detection and mitigation
- Detect service-impacting network events before they affect customer experience
- Trace malicious or suspicious traffic across the network and back to its origin
DDoS Defense:
|
SERVICE PROVIDER
Understand the dynamics of customer and subscriber network utilization to optimize network costs, survey the competitive landscape and discover new revenue opportunities.
- Reveal the third-party content owners and service operators that drive network cost and traffic growth
- Make data-driven decisions to minimize network CAPEX and OPEX
- Improve customer service outcomes with detailed per-subscriber network utilization details
- Equip CSP sales teams with network utilization reports to discover, retain and grow customer revenue
CDN Analytics:
|
OTT Service Tracking:
|
Onboarding
From the start, we offer step-by-step onboarding guidance to help you setup your Kentik environment based on your specific interests and needs. The onboarding includes easy and quick steps to configure the data to be ingested from your devices.
Setup Steps
1. Purpose of your Network
Define the purposes your networks serve, for example, how it:
- Delivers digital products to customers over the internet
- Provides internet service to paying customers
- Provides wholesale internet and carrier services
- Provides enterprise connectivity and services
- Serves application traffic from data centers and/or cloud environments
2. Network Boundaries
Classify IP addresses and ASNs as Internal or External. By doing this, Kentik will be able to profile the traffic as it traverses the network. With these traffic profiles, users can get an immediate sense of where the traffic is coming from and going to in relation to the network’s boundary.

3. Data Sources
Add the data sources that can generate flows — either networking devices or instances from public clouds.

(You will be prompted to enter various device / cloud information in order to send the traffic data to the Kentik Platform.)
For more information, please contact our Customer Success team.
Operate
Network Explorer
Network Explorer is the default landing page of the new Kentik Portal. It curates an intuitive summarized view for all traffic (including cloud) across your entire infrastructure, categorized into different traffic profiles. To be specific:
- Traffic bandwidth consumption for the past 24 hours in different profiles
- Total: All traffic regardless of profile.
- Inbound: Traffic that originates outside your network and terminates inside your network.
- Outbound: Traffic that originates inside your network and terminates outside your network.
- Internal: Traffic that both originates and terminates inside your network.
- Through: Traffic that both originates and terminates outside your network.
- Other: Traffic that is not classified by the above profile

- Traffic summaries for sites and clouds
- A detailed table with customizable tabs (up to 8) to display the information that you are most interested in
- A set of “cards” that show key information and real-time stats for each use case

It’s important to highlight the “Explorer Top Talkers” in the “Operate” box. This provides direct and quick access to the data visualization that ties to specific aspects of traffic beyond just the overview. You can now more easily view your traffic from different perspectives and look for the things you care about the most.

- Sites, Devices, Interfaces, Providers, Connectivity Types, Network Boundaries in the NETWORK & TRAFFIC context
- TCP Traffic, DNS traffic in the HOST MONITORING context
- ASNs, AS Path, BGP Community, INET Family, IP Addresses, Next-Hop ASNs, Packet Size, Protocols, Route Prefixes in the IP & BGP ROUTING context
- Applications, Services in the APPLICATION context
- Countries, Regions, Cities in the GEOGRAPHIC context
- Amazon Web Services, Google Cloud Platform, Microsoft Azure in the CLOUD context
Each Quick View enables users to drill down to any level of detail to help them understand their network better, for example:
- You start by analyzing “Countries” traffic
- You pick the “United States” which ranks #1 for its inbound and outbound traffic
- You pick other attributes such as Sites, Devices, Interfaces to drill further down
- You click on one of the “Sites”, which takes you to another Quick View on that site, including a topology view
- Until you get to a complete conclusion of your current network state
Kentik also enables a very handy way of accessing those views via URL:
- Devices page: portal.kentik.com/v4/operate/quick-views/devices
- Interfaces page: portal.kentik.com/v4/operate/quick-views/interfaces
- Sites page: portal.kentik.com/v4/operate/quick-views/sites

For more information, please see the Network Explorer topic in our Knowledge Base, or contact our Customer Success team.
Insights & Alerting
We revamped our platform around an AIOps Engine, which was designed to surface relevant, actionable and interesting events related to your network traffic, health, security, and applications. This system empowers operators to efficiently identify, troubleshoot and resolve real issues on their networks, and fast.
In short, proactive and interactive insights and human-assisted and machine-powered automation are how Kentik delivers the promise of AIOps for network professionals.
We provide two categories of Insights:
- Custom Insights: Users can define an “Alerting Policy” based on what they know about their network and possible problems.
- Kentik Insights: Kentik’s predefined algorithms, based on our strong domain knowledge, help users understand what they didn’t know, focused on various use cases such as “Capacity Analytics”, “Connectivity Costs”, “Network Health”, “Peering Analytics”, “Threat Activity”, “Traffic Analytics”, “Traffic Trends”, and so on.

With Kentik Insights, network engineers will be able to:
- Have one central place to view both system-detected and user-defined insights and alerts
- Have one central place to view, modify and silence alerts
- Silence Insights related to a specific key (IP address, device, geography) so that the Insights delivered are more relevant

You can always expand the view of a specific Insight and get quick details without leaving the page. From there, you can dig deeper with the links that are provided — either by looking at the details page for the Insight or by going directly to the related Device, Site, AS, whichever the Insight is about.

The notifications from Insights will be filtered and shown in the right panel across the board based on relevancy. If you are on the “Overview” page, all Insights will be shown; if you are on the “Sites” page, only Insights related to “Sites” will be shown, and the same applies to “Devices”, “Interfaces” views, and so on.

For more information, please see the Insights topic in our Knowledge Base, or contact our Customer Success team.
Data Explorer
Data Explorer is one of Kentik’s core functionalities that can be used across multiple use cases.
Data Explorer provides direct views into your network activity and traffic, from a high-level picture down to the deep details. Data Explorer’s key capabilities include unlimited nested filtering and rapid click-through to get you the answers you need fast. This has been a powerful feature that all existing Kentik customers love because it allows easy access to all data, grouped by any variable.
As shown below, we’ve implemented some improvements such as:
- Ability to hide the query window
- Results update automatically with each query change
- Full-width support

For more information, please see the Data Explorer topic in our Knowledge Base, or contact our Customer Success team.
Network Map
Network Map is another core functionality that can be used across multiple use cases. Network Map provides a visual overview of the network topology with every component and real-time traffic across the entire infrastructure.

In a large-scale network, it’s always hard not to lose the big picture while chasing after small details, and vice versa. Depending on your role, Network Map can help answer your questions from both macro and micro perspectives.
If you are a network architect overseeing your entire infrastructure, you can:
- Get an “At-A-Glance” view that shows the important attributes of the network, such as utilization and health
- Understand the network layout and get an idea on how close links are running to maximum capacity
If you are a network operator focusing on one particular site, you can see things like:
- The external connectivity available at each site, also on a per-device basis
- The current ingress/egress bandwidth utilization of each external peering link, also on a per-device basis
- All the devices within the site, how they are connected, and what the bandwidth utilization is for the interconnect links among all of them
If you are a network engineer under tremendous pressure when a critical issue happens, you want to:
- View how sites are connected to providers to determine which ones are being affected by certain issues due to that provider
- Setup different purpose-built Network Map views that your engineers can look at to debug
- Have different teams look at different aspects of the topology (e.g. backbone, edge)
Network Map enables you to take action via workflows. You can always drill down to detail pages from topology panels to solve your problem instantly.
For example:
- If you notice certain links are running close to maximum capacity, you can drill down with the Traffic Engineering workflow
- If you are interested in particular traffic flows, you can always drill down to Data Explorer
- If you have concerns about the health of some links, you can drill down to Insights and Alerting to set alarms for closer monitoring
Roadmap: In the near future, we will add more rich context in Network Maps to help users understand their networks better:
- Add GEO Maps to associate topology with geographic information for more intuitive site-level visualizations
- Overlay Service Maps onto the topology to understand what applications are running and what the traffic patterns are between applications
- Add more visualizations that are use-case specific, such as hosts and host links, VRF, and DDoS
For more information, please see the Network Map topic in our Knowledge Base, or contact our Customer Success team.
Capacity Planning
Infrastructure utilization is directly related to operational efficiency which impacts the business. Bad capacity planning can result in a big mess — either wasting resources or creating congestion when the infrastructure is not keeping up with business growth.
Capacity Planning creates an automated workflow for managing infrastructure capacity. This replaces old, tedious, error-prone manual methods and generates alerts and run-out date predictions so network architects and capacity teams can properly plan their network capacity throughout the planning lifecycle. Planning teams can then easily analyze and optimize costly connections between locations, to the internet and cloud providers.
Capacity Planning can help network architects and network services buyers in the following use cases:
- Network architects need to increase the capacity of the network or manage traffic to reduce utilization in order to prevent congestion
- A network services procurement team has concerns about overprovisioning in many places, but other places have occasional hotspots which cannot be under-served. They need to understand these dynamics and receive automatic notifications.
- Network architects need to view all of the capacity to specific network providers so that they can determine when to make network upgrades or decommission underutilized capacity for that provider
- Network architects need to view all of the capacity to groups of customer interfaces so that they can determine when to make network upgrade recommendations to that customer
To achieve the best planning accuracy, we leverage multiple data sources across the environments as necessary, such as SNMP, flow data and streaming telemetry data. We currently use SNMP data primarily which will be augmented with additional data sources in the near future.
The workflow for Capacity Planning is very intuitive via the following steps:
- Create a capacity plan: define metrics, define aggregation threshold, pick a time range
- Kick off the Capacity Calculation
- Show month-over-month growth, current utilization, expected runout date
- Provide advance notification when approaching the threshold

For more information, please see the Capacity Planning topic in our Knowledge Base, or contact our Customer Success team.
Edge
Peering & Interconnection
Peering is a voluntary interconnection between networks belonging to separate organizations for the purpose of exchanging traffic. There are many motivations behind peering and interconnection, such as:
- Increased redundancy by reducing dependence on one or more transit providers
- Increased capacity for extremely large amounts of traffic (distributing traffic across many networks)
- Increased routing control over one’s traffic
- Improved performance (attempting to bypass potential bottlenecks with a “direct” path)
- Improved perception of one’s network (being able to claim a “higher tier”)
- Ease of requesting emergency aid (from friendly peers)
(source: Wikipedia)
The Peering & Interconnection workflow is designed to help access/eyeball networks, enterprise networks, and content networks to make informed decisions on how to architect their internet edge and structure routing policies in order to reduce costs and/or improve performance.
There are many use cases when it comes to Peering & Interconnection that Kentik can help with. Here are a couple of examples :
For network strategists, architects or operators:
- Find opportunities to save money on transit costs and/or facilitate better performance for customers and applications
- Understand the potential impact of a new peering connection on existing transit and peering links
- Understand where end users are physically located to evaluate peering opportunities in the context of physical proximity to these users, especially for businesses which deliver interactive or latency-sensitive applications
Today’s Peering & Interconnection workflow provides the capability to discover potential peers automatically and identify attractive peering opportunities. By default, the Sankey diagram displays all possible peers, but you can always use the filters (e.g. sites, countries, peering policy, peering traffic ratio, etc.) on the top of the page to narrow that list.

Depending on your business, you may care about peering using different directional perspectives. Kentik can populate the data using both inbound and outbound modes. The inbound mode will help networks that receive a lot of traffic from remote networks. The outbound mode will help networks that send a lot of traffic to remote networks.
The rest of the page will display all the potential peers with more details in a table, with controls to exclude networks which are not good peering candidates.

From there, you can go to the Peer Explorer by clicking on one of the table items to drill in on a specific opportunity to discover how easy or hard it would be to peer with the network in question, and the implications of peering with a specific network. You’ll see things like the AS number and name, a visualization of the last 30 days of traffic, with one-hour granularity, a visualization that shows the bitrate to/from the ASN, unique IP and prefix counts, traffic distribution by country, external traffic details from that potential peer by site and more. You can always type in the URL portal.kentik.com/v4/edge/peering/[asn] to access the information for a specific peer.
For more information, please see the Discover Peers topic in our Knowledge Base, or contact our Customer Success team.
Connectivity Costs
Managing the costs of connecting your business to the world is an essential aspect of controlling your overall service delivery costs. Maintaining a firm grasp on how these costs are allocated, and knowing exactly when they change, can help guide you through critical decisions and planning exercises. However, calculating and making sense of these costs can easily become a full-time job. Kentik now provides a Connectivity Costs workflow to help NetOps teams contextualize and manage these costs quickly and easily — no spreadsheets needed!
The Connectivity Costs workflow aims at helping Kentik customers understand how traffic entering or exiting external interfaces (transit and/or peering interfaces) impacts operational costs. This workflow serves the following purposes:
- Easily use your own network data to check the accuracy of billing statements from network providers
- Visually detect and understand unexpected changes in cost, allowing users to drill into the root cause of these changes
- Surface current cost trends, useful in network planning and forecasting
Roadmap: In a future iteration, we will allow users to surface historical cost trends across providers based on the data, as well as see how customer network utilization impacts your overall costs. We will also soon build automatic insights and report export capabilities.
Configuration Steps
- Interface Classificationneeds to be configured properly as one of the prerequisites because the platform needs to know:
- Whether each interface is external or internal
- What the connectivity type is (e.g. Transit, IX, Paid Peer, Free Peer, etc.)
- Corresponding Provider
- Since it requires using SNMP to poll the interface data, you will need to enable SNMP on your network devices
- Click the “Configure” button at the upper right to add or edit a provider setting
- Add/Edit Provider by inputting the provider’s name, type and billing cycle start date
- Add/Edit Cost Groups info with details such as name, cost model (e.g. Commit or Flat Rate), committed information rate, unite price, and Metered percentile.
- Add/Edit Cost Group Interfaces info to add interfaces to the Cost Group
For complete steps, please refer to the Enabling Connectivity Costs topic in the Knowledge Base.
A very important feature called Cost Rollup gives the “bottom line” cost estimation for all of the computed providers and their associated cost groups. This number is computed by taking the sum of all computed provider groups without performing any additional aggregation at this level.
The Total Ingress and Total Egress figures show the amount of traffic recorded inbound or outbound across the interfaces identified within the cost groups. This is useful as it provides the user with context as to which “direction” of traffic flow they are billed on.
On the same page, you will also find the distribution of “Costs by Provider Group”, “Costs by Site” as well as “Costs by Site Country”, where you can click to dive into detailed breakdowns for each of these important perspectives.
For more information, please see the Connectivity Costs topic in our Knowledge Base, or contact our Customer Success team.
Traffic Engineering
Traffic Engineering is a daily function that nearly all service providers and digital enterprises employ to optimize network performance, control costs and prepare for service interruptions. For instance:
- Eyeball ISP Networks usually have multiple uplinks to different network providers for redundancy to prepare for failover only, rather than utilize all uplinks at the same time
- Transit AS Networks usually optimize their traffic flows by retaining traffic loads within PoPs and minimizing traffic across the backbone
- Content Providers care more about shaping outgoing traffic to ensure performant delivery directly to their end-users
- Others may have concerns with maintaining a balance between incoming and outgoing traffic between and across providers
Our goal is to help our customers to leverage flow data to make sound traffic engineering decisions in an automatic manner, depending on their intentions, instead of routinely adjusting BGP knobs to shift traffic from one network peer to another manually.
We built the Traffic Engineering workflow together with multiple Kentik users who work on the largest peering networks in the world. We listened carefully to their pain points when it comes to handling traffic engineering and developed a solution to address that pain. We also allow grouping traffic using real-world traffic attributes such as AS-Path regex patterns and IP prefixes to simplify the traditional traffic engineering approach.
The configuration is automatic and leverages existing BGP, SNMP and flow data already collected from your network. Assuming these prerequisites are met, you can navigate to the main window to find the particular sets of interfaces that you are interested in, as well as highly-utilized interfaces within the last 24 hours as shown below:
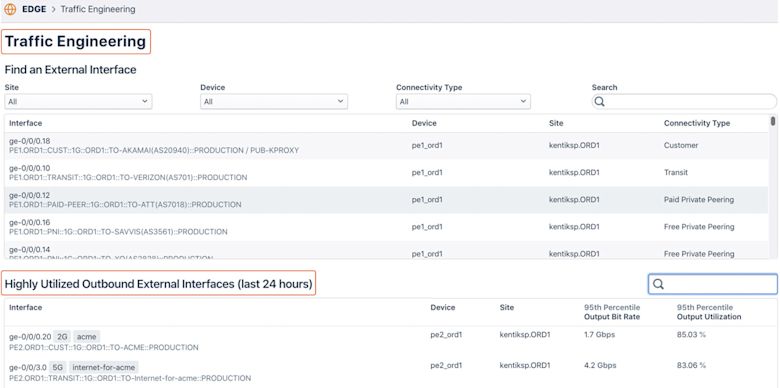
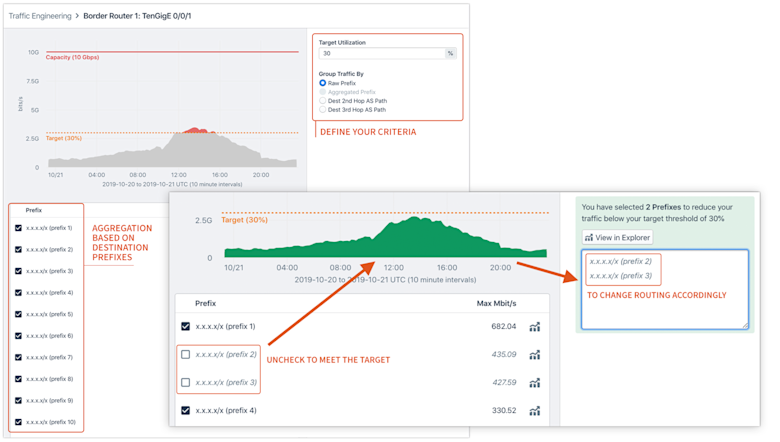
Then let’s say you select one interface to see the current load distribution based on Raw Prefix or Destination 2nd/3rd Hop AS-Path and your target utilization. If the actual traffic load exceeds the target utilization, this amount of traffic will be highlighted, and you can discover the correct prefixes to match on in a routing policy in order to reduce traffic on the interface.
Roadmap: Future iterations of this product will include the ability to sort prefixes by bitwise order as well as automatic aggregation of prefixes.
For more information, please see the Traffic Engineering topic in our Knowledge Base, or contact our Customer Success team.
Protect
DDoS Defense
DDoS attacks have the potential to wreak havoc on your network. Beyond the negative impacts on your service availability, denial-of-service attacks can have serious negative consequences on your team’s efficiency, lower revenues, and hurt your reputation.
Kentik uses flow data as a key signal to determine “normal” vs. abnormal traffic activity. When abnormal conditions are detected, Kentik can step in to reduce the harmful effects of DDoS or even mitigate attack traffic. (Please refer to the DDoS Defense topic on our website for more information.)
On top of our existing, powerful DDoS protection capabilities, we’ve built a new DDoS Defense workflow to make it quick and painless for users by focusing on ease-of-use features and a beautiful and intuitive UI that enables users to:
- Configure the product, fast (in the amount of time it takes to enjoy a cup of coffee)
- Provide immediate attack detection and prevention (so you can rest easy today)
- Help users obtain a deep understanding of their ongoing and historical attacks (so more time can be spent on protecting and operating your network rather than running reports)
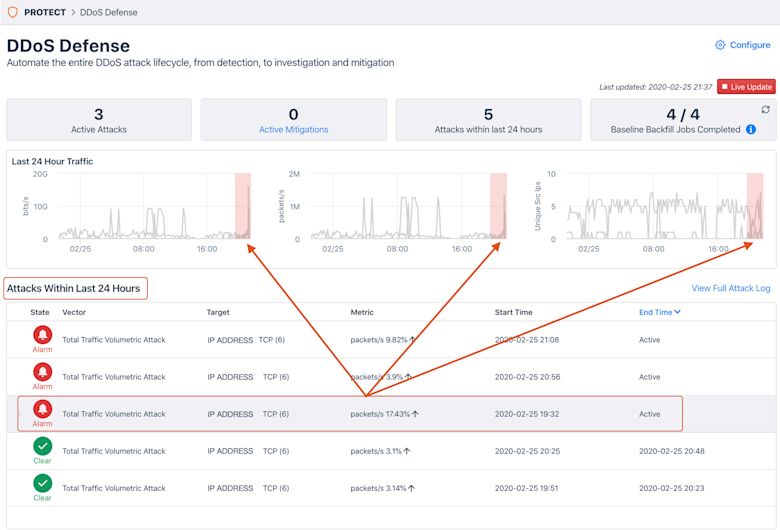
The DDoS Defense workflow is composed of two main parts: DDoS Defense Configuration and the DDoS Defense Dashboard Page. The Configuration part helps users set things up correctly in order to accurately detect attacks. The Dashboard Page gives a view of where users can quickly and easily see details about ongoing and historical attacks and mitigations.
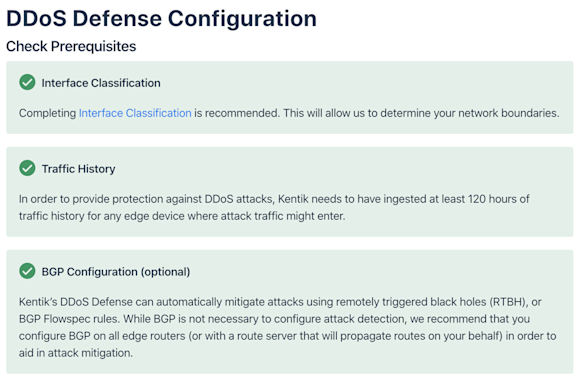
Note, effective DDoS-attack detection requires us to fully understand the structure of your network so that we can differentiate normal traffic patterns from anomalous behavior. Kentik gains this understanding through prerequisites, including: Interface Classification, Traffic History and BGP Configuration. The DDoS Defense workflow walks you through those prerequisite settings step-by-step.
After checking prerequisites is complete, this workflow guides you the ability to the “Enable Attack Profiles” page and select and activate one or more Kentik preset alert policies (20+ of them!) — each of which is designed to respond to a specific attack profile. With a few simple adjustments to a given policy’s threshold settings, you will be able to tailor that policy to the specifics of your network’s traffic.
Once attack profiles are configured, Kentik will start ingesting at least 120 hours of traffic history to accurately detect any attack traffic that might enter later.
After finishing the initial configuration, DDoS Defense by default will take you to the dashboard page to give you a high-level view of DDoS attack activity that has generated alarms from the alert policies that you configured earlier. Each of the attacks can be further expanded with more details, and will be highlighted in the traffic charts above.
For more information, please see the DDoS Defense topic in our Knowledge Base, or contact our Customer Success team.
Service Provider
CDN Analytics
Today, nearly all content providers leverage one or more CDN (content delivery network) providers, which means each CDN normally carries traffic for a multitude of content providers. Eyeball ISPs, whose networks deliver bandwidth to subscribers, are now facing a huge challenge to make sensible engineering decisions that drive business growth without a clear and unified picture of how CDNs factor into traffic delivery. Furthermore, CDNs constantly change delivery sources and paths for each ISP and they routinely modify routing to adapt to ever-changing capacity and cost constraints on their end. All of this adds more complications for Eyeball ISPs to make data-driven business decisions in order to retain subscribers and maximize the ratio of performance versus cost.
Eyeball ISPs need visibility into how CDNs deliver traffic to their end-users in order to operate efficiently.
Kentik now offers CDN Analytics, arming ISPs with the following capabilities:
- Read, track and optimize CDN traffic delivery and performance to subscribers
- Inform interconnection negotiations with CDNs using data-driven analytics
Let’s dive into a few user scenarios where CDN Analytics become very helpful for various roles in Eyeball ISPs:
- Network and NOC engineers need to know when and how routing changes happen for any given CDN that could generate performance impact for their own subscribers. Furthermore, they need to understand and track the cost and performance differences between On-Net CDN caching and Off-Net CDN traffic.
- Infrastructure executives need to know about and evaluate the option of embedding caches from a CDN into their own networks (whether this is a purpose-built CDN or a commercial CDN) to evaluate the decision of improving subscribers’ experience versus cost.
- Network and NOC engineersneed to get alerts and take action to ensure business continuity in the case of:
- Volume change of ingress traffic from a given CDN deviates from the normal level
- Certain connectivity types run out of capacity for a given CDN that will result in further traffic mix change
- A shift of traffic mix from some CDN that will cause an effect on the user performance
- Per-subscriber traffic volume changes for a given CDN or Connectivity Type
CDN Analytics provides a guided workflow to configure all required background data properly which builds a solid foundation to optimize CDN detection accuracy and unlock every view, including:
- Classification for interfaces connected to CDNs via External (IX, Transit, Peering) and Internal (Embedded Cache) interfaces
- Associated providers and their cost group
- Subscriber definition
- Embedded Cache detection (if any)
After setup, the CDN Analytics workflow is able to provide the following capabilities:
- CDN Traffic Overview shows the volume of traffic entering your network from each CDN, which is of interest to peering/interconnection managers and network architects
- Yearly peaks for a given CDN for network engineers and peering managers to prepare extra resources for when the usual peak is going to take place
- CDN provider attributes/profiling that peering/interconnection managers find useful for network strategy
- Connectivity type mix for both current and past, so that peering managers and network architects can consistently try to reduce the amount of costly transit involved in the mix
- CDN offloading - OnNet vs OffNet to see the efficiency of each CDN’s on-net caching solution
- Overview of the OTT services a given CDN carries for NOC engineers and network engineers to identify the source of Specific subscriber issues
Below is a sample look at the CDN Analytics main page. It clearly maps out your CDN vs. non-CDN traffic, traffic by connectivity type, and your top CDNs’ traffic. All the source CDNs will be listed below for users to further drill down. In the right panel below, all the insights related to CDNs are surfaced, driven both by manually configured and system-generated policies.
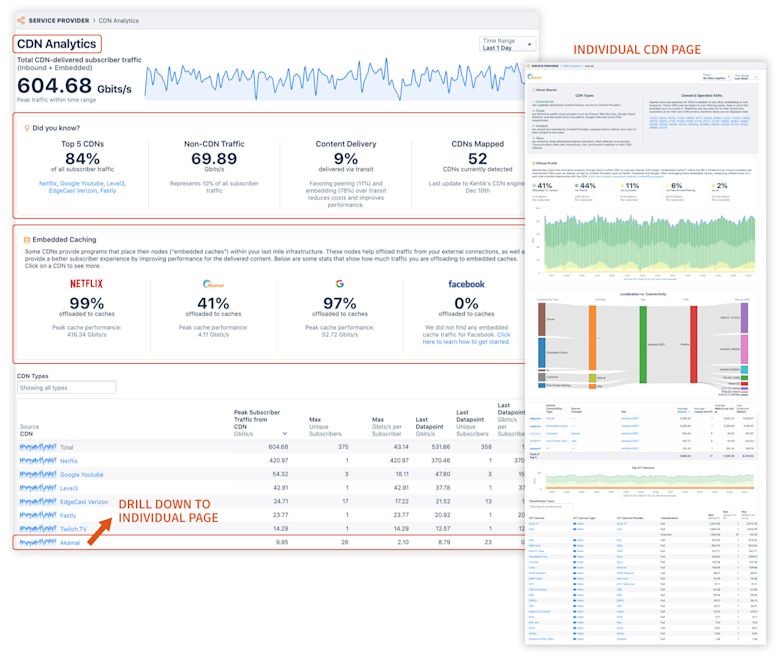
Together, CDN, OTT, and Subscriber (future release) Analytics in our Service Provider product provides a holistic subscriber and content analytics solution.
For more information, please see the CDN Analytics topic in our Knowledge Base, or contact our Customer Success team.
OTT Service Tracking
Eyeball ISP engineering leaders and network strategists need to support many activities, including customer retention, content performance/cost analysis, and content-focused interconnection and planning. They need to react quickly and troubleshoot efficiently to ensure smooth delivery of content towards subscribers. However, there currently aren’t many good ways to get metrics on OTT content services consumed by Eyeball ISP users.
The Kentik OTT Service Tracking workflow gives DPI-like visibility, delivered as a SaaS solution, without the cost, operational complexity and security concerns of appliance-based solutions. The OTT Service Tracking workflow arms Eyeball ISPs with the instrumentation they need to deliver content to subscribers by providing very precise insights such as overlays of delivery methods, subscriber groups, subscriber performance, OTT applications and providers, and more.
Let’s dive into a few user scenarios where OTT Service Tracking can be very helpful for various roles in Eyeball ISPs:
- Network engineers and strategists need to detect and analyze “content events,” then provide timely and efficient guidance for the NOC or hotline for near/long-term remediation (e.g. think about a new Fortnite release)
- Network engineers and QA staff need to define cross-sections of the users to evaluate OTT metrics over those specific sections (e.g. Unique Users, DSLAM/CMTS/OLT aggregation points, Last Mile PoPs, Subscriber Plans, etc.)
- Marketing leaders want to look at the subscribership and Mbps-per-subscriber for a given OTT service to understand the subscriber footprint
- Network engineers and executives need to evaluate the ramifications of zero-rating specific content providers
- Network engineers, ISP quality assurance staff and frontline customer support need to identify users with poor performance towards a given OTT service to maintain and improve customer retention
- ISP executives or ISP security leaders are eager to get insights on suspicious traffic from or between users to discover the possibility of legal liability
- Network engineers or ISP executives want to be alerted when performance decreases from a given OTT service or provider to ensure the customer experience
- And much more…
The OTT Service Tracking workflow provides the following key features to address the above use cases:
- OTT service lookups and meta-data
- DNS data sources provisioning
- Specific OTT hostname matching
- IP-defined OTTs, in addition to the existing hostname patterns
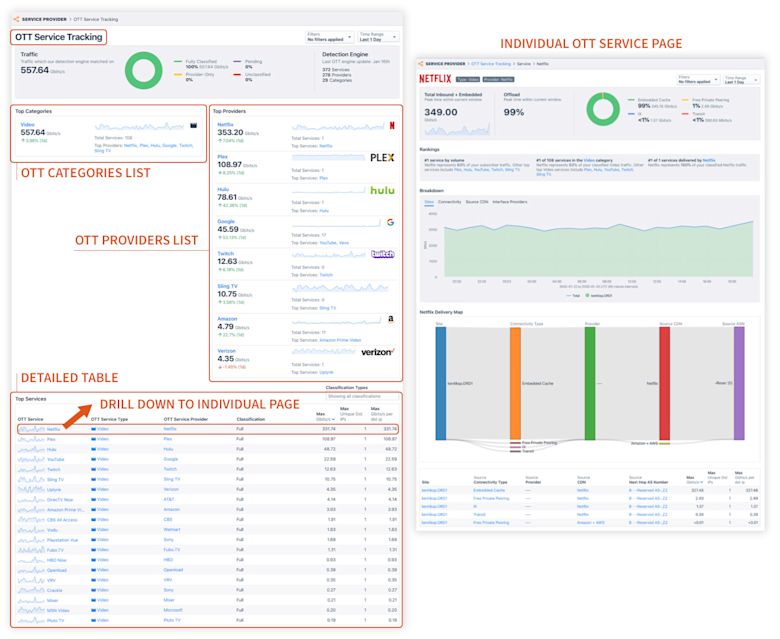
Below is a sample look at the OTT Service Tracking workflow landing page. It gives an overview of your total OTT traffic, traffic by connectivity type, and your top providers’ traffic. All of the OTT service types will be listed below for users to further drill down. In the right panel, all the insights related to OTT are surfaced, driven by both manually configured and system-generated policies.
For more information, please see the OTT Service Tracking topic in our Knowledge Base, or contact our Customer Success team.
Summary
Kentik is AIOps for network professionals. We launched the new Kentik platform in winter 2020 to power up network teams with AIOps techniques like large-scale data collection, correlation, and machine learning to manage the scale and complexity of todayʼs networks.
To see all of the new capabilities in action, you can request a personalized demonstration, or


