kentik Product Updates logo
Back to Homepage Subscribe to Updates

Product Updates

Latest features, improvements, and product updates on Kentik's Network Observability platform.

Labels

  • All Posts
  • Improvement
  • Hybrid Cloud
  • Core
  • Service Provider
  • UI/UX
  • Synthetics
  • Insights & Alerting
  • DDoS
  • New feature
  • BGP Monitoring
  • MyKentik Portal
  • Agents & Binaries
  • Kentik Map
  • API
  • BETA
  • Flow
  • SNMP
  • NMS
  • AI

Jump to Month

  • April 2025
  • March 2025
  • February 2025
  • January 2025
  • December 2024
  • November 2024
  • October 2024
  • August 2024
  • July 2024
  • June 2024
  • May 2024
  • April 2024
  • March 2024
  • February 2024
  • January 2024
  • December 2023
  • November 2023
  • October 2023
  • September 2023
  • August 2023
  • July 2023
  • June 2023
  • May 2023
  • April 2023
  • March 2023
  • February 2023
  • January 2023
  • December 2022
  • November 2022
  • October 2022
  • September 2022
  • August 2022
  • July 2022
  • June 2022
  • May 2022
  • April 2022
  • March 2022
  • February 2022
  • December 2021
  • November 2021
  • October 2021
  • September 2021
  • July 2021
  • June 2021
  • May 2021
  • March 2021
  • February 2021
  • January 2021
  • December 2020
  • October 2020
  • September 2020
  • June 2020
  • February 2020
  • August 2019
  • June 2019
  • April 2019
  • March 2019
  • February 2019
  • January 2019
  • December 2018
  • November 2018
  • September 2018
  • August 2018
  • June 2018
  • May 2018
  • April 2018
  • March 2018
  • February 2018
  • January 2018
  • December 2017
  • November 2017
  • October 2017
  • July 2017
  • June 2017
  • May 2017
  • April 2017
  • March 2017
  • February 2017
  • January 2017
  • December 2016
  • November 2016
  • October 2016
  • April 2016
CoreNew feature
2 years ago

Password strength constraints in Kentik Portal

As Kentik's user base constantly increases, our engineering team is spending a proportionally increasing amount of time evaluating ways to harden the platform's security aspects.

In our ongoing quest towards SOC2 compliance, we recently increased our user password strength stance, please read on to learn more.


Disclaimer: good passwords are not enough

While this feature update is largely focused on how we now incentivize users to select stronger passwords, Kentik recommends to their security-focused users that rely in priority on stronger mechanisms than plain password auth:

  • 2Factor authentication (2FA), whether TOTP Authenticators or YubiKeys
  • Better yet, SAML2 centralized SSO (Single Sign-On) platforms which themselves require 2FA

Initial phase: managing password strength

Password strength is one of the more common measures to harden security around SaaS-based services - it isn't sufficient in itself, but it is necessary. Starting now, users will be required to use a password that complies to a minimum strength level, which we have decided to evaluate using a publicly accessible library named ZXCVBN:

https://github.com/dropbox/zxcvbn

Note: 
Our choice for the password strength library was largely based on this article here: https://www.usenix.org/conference/usenixsecurity16/technical-sessions/presentation/wheeler

This constraint for now applies to two types of users:

  • New users at account activation time
  • Existing users going through the "Forgot Password" steps

This password evaluation step will show up in the login interface as displayed below

The user-submitted password will be evaluated in real-time and assigned one of these levels 5 levels below, with a password being accepted with a minimum level of Good.

  1. No strength
  2. Weak
  3. Fair
  4. Good
  5. Strong

As long as the minimum password strength is not met, the [Set Password] button will be disabled and will exhibit the following alert tooltip:

Until a satisfactory password strength level is met, advice will be displayed below the input field guiding the user toward a stronger one.

This advice is based on a variety of factors such as length, variety of characters, dictionaries of common nouns used, l33tspeak…

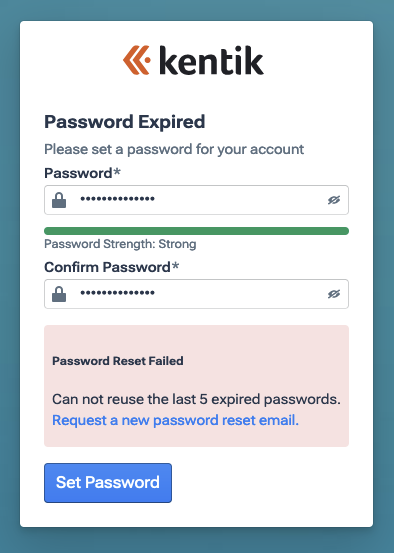
Additionally, when resetting your password, it can not contain any of the previous 5 values, else the following will be displayed:

Next Up, password rotation

While dependent on the SOC2 assessor, password rotation is also one of the common demands around password security.

Therefore, the next phase will consist in having password-only users reset their passwords at regular intervals (90 days by default). We will at this point do the following:

  • Allow SuperAdmin users to set a different frequency
  • 2FA and SSO users will be exempt from such requirements, as they already rely on strong authentication mechanisms.

This change should happen before April 2023 and will be additionally signaled to the impacted users in-product before being rolled out.

Avatar of authorGreg Villain
ImprovementCoreService ProviderAPI
2 years ago

New API endpoints! (AS Groups, Capacity Planning, Kentik Market Intelligence)

Today, we are adding a set of new endpoints related to various workflows in the Kentik Portal. 

Read on!


The first thing to know before we get into the details is that you can always access our API sandbox from the navigation menu here:

We have recently added a set of previously unreleased endpoints to our v6 API, all can be visible at the following URLs in the portal:

  • https://portal.kentik.com/v4/core/api-tester/ on the US SaaS Cluster
  • https://portal.kentik.eu/v4/core/api-tester/ on the EU SaaS Cluster

These new endpoints cover three main areas of functionality:

  • Custom AS Groups CRUD functionality
    This new endpoint set only covers the management of these AS Groups. Ongoing work is scheduled for the Data Explorer Query API to be compatible with AS Group rollups, but the release date isn't yet set.

    SCR-20230313-iom.png

  • Workflow APIs

    • for Capacity Planning
      The set of endpoints we’ve added to Capacity Planning is for now exclusively centered around viewing either a summary of all capacity plans or details of specific plans. 

      SCR-20230313-ip2.png

    • for Kentik Market Intelligence
      This set of API endpoints allows users to either get any ranking with any Customer-base type in any market or get customers and providers of any given network in any given local market.


Important note
The sandbox shown in the article is the one of the v6 of our API. We still have a v5 API which still covers a large amount of legacy unmigrated endpoints - the testing UI for them is located here:
https://api.kentik.com/api/tester/v5

Avatar of authorGreg Villain
ImprovementCore
2 years ago

Dots and Dashes in device names! (yes, you read that right)

This may not look like much, but it's big. I have been a Product Manager for more than 6 years at Kentik and when joining in 2016, I remember asking why our users couldn't give names with dots (".") and dashes ("-") when registering them in Kentik.


It wasn't easy back then but we've progressively removed all the technical hurdles to progressively enable this. (Trust me, it wasn't easy).

Today, I am very happy to announce that your device can now contain dots and dashes in their names!

As they are saying: "Great things come to those who wait"

Important note
While you can now rename all your existing devices, please be warned that any Saved Filter relying on Device Names will have to be updated accordingly to reflect any change you make to its name.
Similarly, if any dynamic Cost Group or Capacity Group relies on device naming you will also have to update them

Avatar of authorGreg Villain
ImprovementService Provider
2 years ago

CDN Analytics update

Our CDN Analytics workflow relies on a detection engine which both takes into account your own Kentik configuration (via Interface Classification) and its constant scanning of the internet to detect IPs from CDN Servers out on the Internet. In this release, we added means for our users to help it better detect, or take into account undetected CDN caches that they are embedding in their networks.


Important note: New configuration possibilities offered by this workflow update are highly advanced - if you feel like you need to use this feature, please seek advice from your Customer Success Engineer.

Understanding Kentik's CDN detection engine

Kentik enriched flow data includes src_cdn and dst_cdn fields, and these are accessible in Data Explorer as well as the namesake workflow CDN Analytics, they are also leveraged within the OTT Service Tracking workflow. 

Values for these flow columns come from Kentik’s special sauce: every day a complex engine runs and evaluates multiple data-sets to map as many IPs as possible to CDNs. src_cdn and dst_cdn are then populated in flow records using this global (,) mapping table.

Datasets used by the engine for classification

CDNs can be a mix of servers either hosted on the CDN’s own network infrastructure, or inside of other networks. While servers hosted on the CDN’s own infrastructure are somewhat easy to detect, last mile embedded caches aren’t, because they’re addressed with the embedding broadband ISP’s address space.

The CDN detection engine uses a combination of the methods below, when it runs every day:

  • Internet Scans data
    Determines how public CDN cache server IPs are detected, as well as a portion of last mile embedded caches.
    This process is not detailed in the present article.
  • Kentik Customer data
    This mechanism helps with detecting IPs of embedded caches that are not identified by the previous datasets.
    This detection mechanism is based on a customer’s Interface Classification accuracy.
    The engine pulls and inspects all interfaces whose Connectivity Type is set to Embedded Cache and look at the Provider value for the interface. We perform a loose match with the Provider field then assigns the interface's subnet to the CDN that has been matched with our database.

This example shows an Interface Classification Rule which will result in the associated interfaces' subnets to be picked up by the CDN detection engine and associated to a CDN.

This example shows an Interface Classification Rule which will result in the associated interface subnet to be picked up by the CDN detection engine


Corner cases for Embedded Cache detection

While this approach has shown good results, some customer setups make it difficult to entirely (or sometimes correctly) detect Embedded Cache IPs. The examples below detail such corner cases.

Situation #1

Here, the interface tagged Embedded Cache is actually a /31 or /30 point-to-point subnet to connect with another Network Device on which the Embedded Caches are located, with the aggravation that this Network Device is not sending Flow Telemetry to Kentik.

In this case, two things will happen:

  1. the engine will mislabel the /30 or /31 to a CDN if its provider field is set and matched (this happens for Facebook FNA caches, CDN77 caches... which often come with a router shipped with the caches by the CDN provider)
  2. the engine will be missing the Caching Server Subnet below for not having any Interface Classification from the non-kentik-registered router.

Situation #2

This situation is pretty similar to the previous one, with the additional complication that the interface sending flow data is not tagged as Embedded Cache by the Interface Classification rules.

In this instance above, the CDN Engine cannot detect the subnet where the cache servers are, because it doesn't have an Embedded Cache interface to pickup the subnet from.

Solving for these situations: the new CDN Analytics configuration screen

Inspecting and amending CDN Engine detected cache entries

To remedy both of the aforementioned situations, the Configuration button in the CDN Analytics workflow will allow for fine grain additional configuration.

The first tab of this configuration screen, Detected Embedded Caches, will:

  • List all the subnets detected from Interface Classification and the associated Provider values, as well as the CDN that's been assumed from the Provider value
  • Let the user disable those that are tagged Embedded Cache but whose subnet is not a cache subnet (example of Situation #1)
  • Add a CDN Provider to any interfaces labeled Embedded Cache where the Provider value hasn't been set, therefore which the CDN Engine couldn't make a CDN attribution decision on.

Manually declaring undetected Embedded Caches

To also address the situations of having caches behind non-Embedded Cache classified interfaces, and therefore undetected by the CDN Detection Engine, users have the option to manually declare CIDR blocks and assign them to CDNs, via the Additional Embedded Caches tab of this configuration screen.

Entries in this configuration section will now be picked-up with every daily run of the CDN Detection Engine and will be added to the global  (,) dataset in use by all our customers.

Understanding how the CDN Analytics workflow leverages your Network Telemetry

Bolting src_cdn and dst_cdn values into your enriched flows is not the only thing that needs to happen for your CDN Analytics workflow to display accurate data.

The workflow needs to inspect the right flow data from your Network Devices to deliver a cohesive analysis of the CDN traffic that not only enters your network, but also is generated from embedded caches within it. To do so, this workflow uses this generic filter:

As you will notice, this filter will work perfectly as long as all of the Embedded Caches in your network are connected to a router exporting flow data to Kentik. When this is not the case, the flow data to include will simply not be collected by Kentik from the interface facing the cache. 

it is important to understand that mapping Cache Server IPs and selecting all the cache related flow telemetry are two aspects that need to work for the CDN Analytics workflow to display accurate results.

In the previously discussed Situation #1 and Situation #2, flows coming from the cache servers will not be considered by the filter displayed above, therefore we need ways to add these to the filter-set that regulates what flows the CDN Analytics workflow will consider.

Tuning the CDN Analytics workflow to include non Embedded Cache traffic

Let's go back to Situation #2

Now we want the CDN Workflow to include traffic from the Caching Server Subnet to the data it will display in its analysis. This will be done by using the Advanced Filtering section of the CDN Analytics configuration options:

As you can see in the screenshot above, traffic from eth0/0/1 on the edge-01 network device coming from the Cache Subnet would not normally be caught by the default filter, adding it modifies the CDN Analytics behavior to include it now.

Avatar of authorGreg Villain
ImprovementCore
2 years ago

Streaming Telemetry: device configuration and status

The Streaming Telemetry (ST) is now officially supported in the Kentik Portal. Users can enable Streaming Telemetry from the Device configuration dialog which is shown in the screenshot below.

This will enable Kentik Saas Ingest or Kentik kproxy to start receiving Streaming Telemetry from that Device.

The details about the configuration of the kproxy for using Streaming Telemetry can be found on the this KB article.

The status of the Straming Telemetry is shown on the Settings → Devices page with the additional “ST” flag. This flag shows the status only for devices which have ST enabled. The Streaming Telemetry status is additionally shown when the device is selected or in the Network Explorer Device Quick view page under the “More Info” Tab. Example screenshots are shown below.

Device Inventory page showing the Streaming Telemetry status with enabled filtering

Network Explorer Device Quick-view page showing Streaming Telemetry status

At the moment, Kentik supports the following ST formats:

  • Junos native JTI telemetry sent over UDP. Currently supported sensors are for interfaces statistics:
    • /junos/system/linecard/interface/
    • /junos/system/linecard/interface/logical/usage/
  • Cisco IOS XR native dialout telemetry with self-describing GPB format which is sent over TCP. Currently supported sensor path is for interfaces statistics:
    • Cisco-IOS-XR-infra-statsd-oper:infra-statistics/interfaces/interface/latest/generic-counters

If a user wants to configure device to send ST directly to Kentik SaaS ingest, it should send it to port 20023. If the ST is sent to kproxy, it can be sent on any port, which is configurable as part of the kproxy configuration (a port 9555 in used Kentik’s documentation as an example).

More information about the ST can be found in our Knowledge Base:

  • SNMP and ST
  • Kproxy configuration for ST
  • Example device configuration snippets for Juniper MX and Cisco XR

Please let us know if you are interested to enable Streaming Telemetry from your devices and if you would like to have support for additional sensors or other Telemetry formats?

Avatar of authorDuĊĦan Pajin
Hybrid CloudNew featureFlow
2 years ago

Flow Logs Sampling Configuration

We released a new configuration knob that allows customers to change the sampling rate for AWS and Azure on their own without contacting Kentik team.

That will allow customers to consume flow logs at the preferred rate fitting into the licensing strategy, assigning priority for certain types of traffic and being flexible by changing the sampling rate at any time and separately for each flow log exporter.

Licensing will be enforced after the sampling, so customers can use heavier sampling in some cases, and saving the licensed FPS for the another S3 buckets containing flow logs.

There is a slight difference in available options for AWS and Azure.


AWS flow log sampling

Historically Kentik was supporting a “legacy” mode of sampling where for the large files with flow logs we were randomly picking 10,000 flow records per file in S3 bucket and ingesting only those records into Kentik Data Engine. Since the number of the flow in a file can vary this was considered an “adaptive sampling” where larger files were getting more heavily sampled comparing to the smaller files. Another option was no sampling i.e.  all the records were consumed from the file.

Moving forward we now support 3 options for AWS:

  • Legacy sampling - random 10,000 flow records per file.
  • Sampling rate - where user can provide the sampling rate in 1:N format (meaning 1 out N records to be picked up for an ingest into Kentik Data Engine), where N should be between 2 and 2000.
  • Unsampled - all the records in a flow log file will be taken into ingest. Effectively that is the same as sampling rate 1:1.

Sampling rate can be configured when new flow log file is added, or changed for the existing exporter.

Azure flow log sampling

Flow log exporters for Azure before this release were supporting only Unsampled mode, where all the flows from the flow log file were processed by the Kentik Data Engine.

Since for some situations full flow log visibility might be not required, we added sampling knob that allows users to configure sampling rate 1:N format (meaning 1 out N records to be picked up for an ingest into Kentik Data Engine), where N should be between 2 and 2000.


Avatar of authorIevgen Vakulenko
Hybrid CloudCoreNew feature
2 years ago

Data Explorer: Filtering Based on Tags for Azure

Customers who are using Azure tags within their cloud infrastructure can import those tags into Kentik and use them as a Custom Dimensions within Kentik Data Explorer.

This import can be configure as any other Custom Dimensions configuration, under Settings - Custom Dimensions - Add Custom Dimensions

After that user is able to pick up which Azure Entities will be used to generate the Custom Dimensions from:

After Kentik will populate custom dimensions that were chosen (can take up to 30 min), they became fully available in a Data Explorer, under the section “Custom”.

Note: other custom dimensions are shown on the picture as well. Dimension that was generated from Azure tag is highlighted.

We also wanted to use this opportunity and remind that AWS tags are supported as Custom Dimensions as well 🙂.

Happy flow hunting!

Avatar of authorIevgen Vakulenko
Hybrid CloudCoreNew featureKentik Map
2 years ago

Azure NSG denied traffic visibility

It’s possible now to check for a traffic flows that were denied by the NSG rules configured on a Subnet or VNET level.

There are two ways how you can see that traffic:

  • It’s available on a Kentik Map as a sidebar “Details” widget (similar to existing AWS functionality)
  • You can search for them in a Data Explorer using source and destination Firewall Action as a dimensions, and change the metric to the flow/s.
    This feature will be a significant aid in troubleshooting the NSG firewall issues and decrease mean time to resolution.


Avatar of authorIevgen Vakulenko
Hybrid CloudCoreNew feature
2 years ago

Data Explorer: Filtering based on tags for AWS

Kentik Data Explorer supported filtering based on instance tags for a while now, but now we are expanding the tag support for other cloud objects as well, such as: VPC, Subnets, ENI, VPC endpoints and Transit Gateway attachments.

No matter what object you assigned a tag on, you can use Data Explorer for filtering traffic flows related to those tags.

In order to start using the AWS tags you need to create custom dimension through the Settings - Custom Dimensions - Add Custom Dimension.

After that you can automatically populate your custom dimensions with AWS tags and pick what fields you want to use in your Data Explorer for filtering.

After Kentik will populate custom dimensions that were chosen (can take up to 30 min), they became fully available in a Data Explorer, under the section “Custom”.

This will allow you to filter the traffic flows using the tagging and naming convention of your organization, for instance to see the traffic of a particular team, business unit or division.

Happy flow hunting!

Avatar of authorIevgen Vakulenko
ImprovementSynthetics
2 years ago

DNSSEC validation in DNS Monitor tests

DNS was designed in the 1980s when the Internet was much smaller, and security was not a primary consideration in its design. As a result, when a recursive resolver sends a query to an authoritative name server, the resolver has no way to verify the authenticity of the response. DNSSEC was designed to address this issue.

DNSSEC adds two important features to the DNS protocol:

  • Data origin authentication allows a resolver to cryptographically verify that the data it received actually came from the zone where it believes the data originated.
  • Data integrity protection allows the resolver to know that the data hasn't been modified in transit since it was originally signed by the zone owner with the zone's private key.

Up until today, the DNS Server Monitor Test only allowed a user to monitor the DNS resolution for a given hostname from specified Name Servers. Users can be alerted if the resolution time crosses a particular threshold or if an unexpected DNS response code is received, or a non-allowed IP is answered.
However, these tests previously did not validate the DNSSEC trust chain of the received record.
Enter DNSSEC Validation.

How can you configure DNSSEC validation?

When enabled for a given domain, the test will recursively check the validity of each signing entity in the chain from the authoritative name server up to the root server. The result will be either a positive or a negative response. The DNSSEC record is either fully verified or it isn’t.

When the option is active, the test results will show the DNSSEC validation status for each one of the Agents involved in the test.

Validity of DNSSEC is based on querying DS and DNSKEY for any of the successive parts of the domain name: for a DNS test target of subdomain.domain.tld, each of tld., domain.tld., subdomain.domain.tld. and . (root) will be tested.

Traces for the DNSSEC validation for each agent will be available by clicking on their respective status icon on the previous screengrab.

DNSSEC validation impact on subtest health

Health options remain the same as the DNS Server Monitor test. DNSSEC validation will have a boolean result. If validation is successful it’s a healthy result, if not, it's critical. 

If enough agents have a critical results (see screenshot above) to meet the sub-test threshold condition, an alert will be triggered.

IMPORTANT NOTE: App Agents vs Network Agents

Be advised that setting DNSSEC validation is available to all agents except Private Network Agents. As a reminder, our new Private App Agents not only include all of the capabilities of the legacy Network Agents, but also include the capabilities required for advanced Web tests such as Page Load Tests and Transaction Tests.

If you currently run our legacy Network Agents, please consider replacing them with our new App Agents to gain access to all of the feature we will add in the future. Kentik's entire fleet of Network Agents has already been migrated, and support for the Network Agents will be phased out in 2023 (more to come on this soon)

Avatar of authorGreg Villain