kentik Product Updates logo
Back to Homepage Subscribe to Updates

Product Updates

Latest features, improvements, and product updates on Kentik's Network Observability platform.

Labels

  • All Posts
  • Improvement
  • Hybrid Cloud
  • Core
  • Service Provider
  • UI/UX
  • Synthetics
  • Insights & Alerting
  • DDoS
  • New feature
  • BGP Monitoring
  • MyKentik Portal
  • Agents & Binaries
  • Kentik Map
  • API
  • BETA
  • Flow
  • SNMP

Jump to Month

  • March 2023
  • February 2023
  • January 2023
  • December 2022
  • November 2022
  • October 2022
  • September 2022
  • August 2022
  • July 2022
  • June 2022
  • May 2022
  • April 2022
  • March 2022
  • February 2022
  • December 2021
  • November 2021
  • October 2021
  • September 2021
  • July 2021
  • June 2021
  • May 2021
  • March 2021
  • February 2021
  • January 2021
  • December 2020
  • October 2020
  • September 2020
  • June 2020
  • February 2020
  • August 2019
  • June 2019
  • April 2019
  • March 2019
  • February 2019
  • January 2019
  • December 2018
  • November 2018
  • September 2018
  • August 2018
  • June 2018
  • May 2018
  • April 2018
  • March 2018
  • February 2018
  • January 2018
  • December 2017
  • November 2017
  • October 2017
  • July 2017
  • June 2017
  • May 2017
  • April 2017
  • March 2017
  • February 2017
  • January 2017
  • December 2016
  • November 2016
  • October 2016
  • April 2016
ImprovementInsights & AlertingDDoS
7 months ago

Policy Configuration: Build and Edit your Policies

The new Alert Policy editor introduces a common policy authoring experience for both Custom policies and DDoS policies. You can navigate here from the Policies page, or by selecting a template from the Policy Templates page to use as the prototype for a new policy. 


We’ve redesigned this experience to simplify configuring and enabling a policy to trigger alerts. The same configuration options apply for constructing both DDoS detections and custom alerts, and the workflow to configure these is the same. 

Configuring alerts can be complex, but constructing the conditions for alerts is both powerful and very flexible. We've done some work in this revision to accelerate and simplify the process of building a policy.

Let's start with navigation. There are four tabs in the policy editor; you navigate to each of them by selecting the heading at the top of the form.


You'll also notice a new "Summary" display on the right side of the page, to help keep track of values from other tabs as you work, and also to see and correct validation issues that arise.

Clicking on validation issues will navigate directly to the tab where you can resolve the issue.

In the General tab, you'll describe the policy - naming it, and providing a description of your intent. This is also where you'll enable the policy to create alerts, or to silence it while it build baselines. This is also where you can specify a dashboard to display alerts triggered by this policy.

In the Dataset tab, you'll define the focused subset of data you're interested in evaluating. This is the data that will be examined and tested against the conditions that will be defined in the Thresholds tab.

The controls on this page are similar to the controls you're familiar with from the Data Explorer - defining sources of data, and the specific dimensions and metrics that will make up the information this policy will evaluate against each of the threshold defined in the next tab. This is also where specific filters can be applied to refine or exclude data that should not be evaluated.

You can read more detail about the dataset selection dialogs in the Kentik Knowledge Base article "Alert Policies" topic.

One new feature you'll notice here is that the content of this page has been simplified, compared to the previous release - and all of the more complex and detailed options have been moved into an expandable area at the bottom of the page in "Advanced Settings."

For most alerts, you won't need to change the configurations here, but they are available to advanced users for specific use cases.  Refer to the Knowledge Base for more detailed guidance on setting these parameters.

Moving to Thresholds, you'll see five tabs that define threshold conditions and actions for each of the five levels of severity.

Conditions describe when alerts will be triggered for this level of severity; you can define conditions for traffic volumes, presence in the top keys, capacity for an interface, or ratios between metrics. Ratio conditions are new with this release, and evaluate the relationship between metrics to determine a trigger for the alert.

Actions describe automated notifications or DDoS mitigations that will be executed when the alert is triggered.

Finally, the Baseline tab has been simplified to offer one of three presets. Each of these describes how baselines for threshold conditions are constructed.

In most cases, the Default preset will produce a useful baseline for most alerting applications. You can select "Express" to produce a baseline more rapidly, or "Precision" to build a more detailed baseline over a longer period of time.

In this tab, you also have access to the individual detailed configuration parameters through the "Advanced Options" area.

Finally - there are preconfigured Policy Templates you can access from the Policies page, or through the "Add Policy" dialog: 

Policy Templates are prototype policies you can copy and customize for your requirements. Selecting a policy template here provides the same Summary view of the values in the template to guide you make a useful selection.

This represents our initial body of work to simplify the Alerting workflow, and we hope you find these changes easier to work with. We appreciate that with each changes comes a learning curve, so we'll work to improve this area of the product incrementally. 

As always, please let us know what you think in the comments!

Avatar of authorJoe Reves
ImprovementInsights & AlertingDDoS
7 months ago

Policies: Triggers for Alerting

Building on the work to navigate alerts, we've modernized the Policies page and unified the view of DDoS and Custom policies into a single flexible browser. 

We're making use here of our new standard table layout with common controls, filters, and workflow navigation. This is where you'll find a list of your configured policies for custom volumetric and dimension based alerting, as well as your DDoS policies for detection.


Navigation to the Policies page is contextual; you can find Policies from the unified Alerting page, as well as from the "Configure Policies" link on the DDoS defense page. When you navigate from DDoS Defense, you'll land with the appropriate filter to see your DDoS policies.

We’re providing improved filtering and sorting options, and context specific navigation. You can easily determine the policies that are active, and the types of policies available.


 This page is your path to creating new policies, and modifying existing ones. 

You can also review pre-configured policy templates - prototypes you can use to quickly customize new policies for your environment. 

Bulk operations are supported here - select multiple policies to enable or disable a group of policies, or delete them. 

As with the other pages using this common table layout, some of the columns are sortable by clicking on the column header.

Let us know what you think in the comments!

Avatar of authorJoe Reves
ImprovementInsights & AlertingDDoS
a year ago

DDoS and Alerting: December 2021 quick update

The mitigations UI/UX experience has been updated this December, these few changes are the initial steps towards a much longer Q1 2022 Alerting and Mitigation push, stay tuned for more.


Mitigations

  • Mitigation controls - integrations complete for policies, support in v4
  • Added acknowledgment required for thresholds
  • Multiple mitigations are supported per policy
  • Mitigation apply/clear timers per policy


Avatar of authorJoe Reves
ImprovementInsights & AlertingDDoS
a year ago

DDoS, Alerting, Notifications: Aug/Sept 2021 major update

Custom HTTP Headers for v2 Webhook Notification

The custom webhook notification method in v2 notifications (/v4/settings/notifications) now supports the ability to customize the HTTP headers and values sent with the request, in addition to the request body.

Among other uses, this allows users to provide authorization credentials for API endpoints that require it.

Additional v2 Notification Methods

Notifications v2 now supports all of the notification methods that were supported in notifications v1, along with a few new ones like Microsoft Teams, VictorOps and xmatters.

In addition, with customizable HTTP headers and request body templates in the Custom Webhook method, it should now be possible to do one-off integrations with virtually any third party API.

NOTE: Some notification methods are not yet available to select as destinations for Synthetics notifications. Template updates are required for these methods to properly present the different data fields associated with Syn notifications.

v2 Notification Support for v4 DDoS Policies

v4 DDoS policies now support the selection of both v1 and v2 notification methods as destinations for alert notifications. In the thresholds section of the policy configuration, users will now see both v1 and v2 methods shown in the drop-down list.

Each available notification channel is labeled with the notification method type, though we do not distinguish between v1 and v2 types since these are not user-facing designations. We’ve also temporarily removed the link to the v1 notifications configuration page until we have migrated all v1 methods to v2.

Native v4 UI Forms for Mitigation Configuration

Mitigation platforms and methods are now configured via a native v4 UI form. The new form combines platform and method configuration onto a single page with a better UX that shows which methods are associated with each platform.

The new form also removes the limitation on configuring both RTBH and flowspec mitigation methods on the same router.

Ratio-based Thresholds

We’ve added an additional threshold type for DDoS policies, which allows the user to compare two different metrics that are measured by the policy. Along with this, we’ve added some additional metrics that measure separate inbound and outbound packets/sec and bits/sec rates. The metrics that are compared in a ratio-based threshold must be metrics that are configured as primary or secondary metrics for the policy.

Some use cases where ratio-based thresholds can be useful:

  • DDoS policies: Comparing bits/sec in to bits/sec out can make it very easy to detect attacks for content / server destinations, since these resources almost always have a much greater traffic volume out than in. If this ratio reverses, it can be indicative of an attack and ratio-based detection doesn’t require knowledge of the actual traffic volumes.
  • Peering policy violation: Many settlement-free peering agreements are based on exchanging traffic with the other party at 1:1 ratio. Setting a ratio-based threshold on a policy that looks at interface traffic in / out can detect possible violation of agreement terms by the other party.

Ratio-based policy thresholds allow the ratio to be compared in both directions (i.e. A:B and B:A) or one direction only. In the both directions case, an optional margin parameter effectively lets the user define a “band” of acceptable ratios, with values above or below the band triggering the threshold condition.

Avatar of authorJoe Reves
Insights & AlertingDDoS
2 years ago

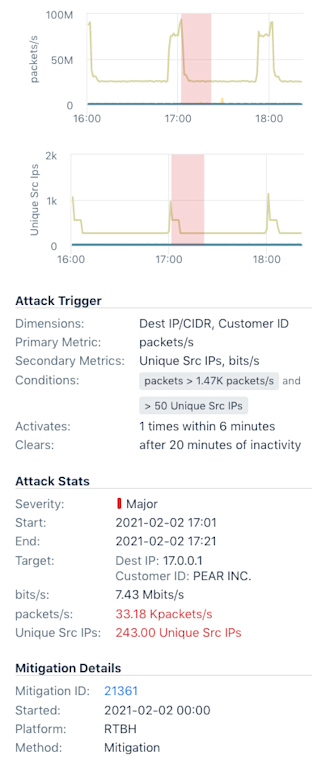
DDoS Mitigation: February 2021 Update

Kentik DDoS detection leverages network analytics and insights to deliver a detailed picture of your traffic, serving to identify and mitigate DDoS attacks in real time. This service protects organizations’ networks and ensures business continuity.

We’ve made a number of improvements to v4 DDoS detection and policies, see for yourself:


  • The mitigation list in v4 now shows all mitigations, regardless of whether they were triggered by v3 or v4 policies.
  • Mitigation list now includes the mitigation ID.
  • Alerts and mitigations are now cross-referenced. Alert summaries and details show any related mitigations and vice versa.


  • Configured thresholds are now displayed immediately in the policy configuration. Previously, thresholds were displayed only after the graph finished loading.
  • Thresholds must now be configured in order (i.e. “critical” must have higher threshold values than “major”).
  • Threshold lines on the graph now use colors with more contrast to make them easier to distinguish.
  • General cleanup and bug fixes in policy configuration, including IP exclusions
  • DDoS alert log is now searchable by multiple dimensions, including full or partial key values.


Avatar of authorJoe Reves
ImprovementSyntheticsInsights & AlertingDDoS
2 years ago

February 2021 feature update summary

Synthetics

Kentik’s product and engineering teams continued rapid iteration on Kentik Synthetics. The mesh test display has been greatly enhanced to handle large meshes, and synthetics widgets are now available for dashboards and My Kentik Portal. Flow-based traffic data has also been added to mesh test results. This builds on Kentik’s unique combination of synthetics and real traffic information to help our customers easily choose and set up the right tests.

New Insights

We’ve also added a number of new traffic comparison insights looking for traffic volume changes, changes in volume for cloud services and regions, and changes in OTT dynamics.

Alerting, DDoS & Mitigation

On the DDoS front, we’ve delivered a number of improvements requested by customers. Some are focused on better visibility into mitigation actions and others on usability improvements for policy configuration and alert history.

Avatar of authorJosh Jensen
ImprovementDDoS
2 years ago

Misc. DDoS Improvements

We have identified and improved several DDoS features as requested by our customers, with more to come. 

Here is a summary of the recent enhancements:

  • We’ve added 1-minute interval polling for our threshold queries, ensuring that users can trust the data represented on the screen when configuring policies
  • Users can now customize DDoS policies to include different dimensions or metrics to create a more tailored detection system or experience for their network
  • The workflow to set up DDoS policies now includes user-friendly options for quicker configuration
  • Users can now create ad-hoc policy metrics and dimensions
  • We now support “Greek prefixes” (Gbits/s, Mbits/s, etc.) for policy configuration
  • We now illustrate accurate max values over a time series data set, ensuring that we don’t steer users towards configuring artificially low thresholds
  • The mouseover no longer blocks the useful data displayed in the threshold window
  • Amplification policies are now simplified
  • Disabled policies remain visible
Avatar of authorJoe Reves
ImprovementInsights & AlertingDDoS
3 years ago

Email Alert Enhancements: Embedded Dashboard and Data Explorer Links

When an alert is raised, it can be sent via notification channels including Email, Slack, PagerDuty and more. We now embed the “Dashboard” and “Data Explorer” links that are associated with that alarm in the Alerting Email Notification as shown below.

This allows the user to quickly jump to the appropriate view and reduce problem resolution times, rather than manually pulling up the needed reports. Dashboard and view links will soon be integrated into other alerting channels as well.


Avatar of authorJoe Reves
DDoSNew feature
4 years ago

Mitigation with BGP Flowspec

Like Remote Trigger Blackhole (RTBH), Flowspec is a means of using BGP to respond defensively to a DDoS attack. But while RTBH is a blunt instrument, dropping all traffic toward the victim's IP address, Flowspec lets you respond to attacks with surgical precision. It offers a greater range of possible mitigation actions and it’s also far more granular in terms of defining which traffic is affected by those actions.


Based on IETF RFC 5575, Flowspec works by distributing a “flow specification” that can be read by any routing system that supports MP-BGP. The Flowspec defines a filter for matching traffic based on certain packet properties (IP, ports, protocol, etc.) as well as an extended community value that specifies actions to take on matching packets (drop, forward, rate-limit, etc.).

Kentik’s support for Flowspec-based DDoS mitigation is integrated directly into our powerful anomaly detection and alerting system, enabling our customers to leverage the built-in traffic filtering capabilities of their existing network hardware. For our initial “preview” phase of Flowspec support, the following Flowspec capabilities are now implemented in Kentik Detect:

  • Manual Flowspec mitigation
  • Flowspec mitigation from alarms
  • Programmable Flowspec mitigation via “Infer From Alarm”

Flowspec Setup

The workflow for Flowspec setup is detailed in our Knowledge Base topic on Configuring Flowspec Mitigation, but here’s an overview of the process:

  • Configure devices for Flowspec
  • Enable Flowspec in Kentik device admin
  • Create a Flowspec mitigation method
  • Specify Flowspec conditions and actions
  • Create a Flowspec mitigation platform
  • Link the method to the platform

Once we’ve created a Flowspec we can use it in a couple of different ways. The most common application would be to deploy an automated Flowspec mitigation, which means that we assign the mitigation to a threshold in an alert policy (as shown above), so the mitigation is triggered when the threshold’s conditions are met. Alternatively, you can deploy the Flowspec mitigation manually as described in Start a Manual Mitigation.

For more information, please see our blog post Kentik Takes a Leap Forward in DDoS Defense and the Flowspec Mitigation Knowledge Base topic. To discuss the benefits of Flowspec, or to enable Flowspec support for your organization, please contact the team at Kentik Customer Success.

Avatar of authorJoe Reves
ImprovementInsights & AlertingDDoS
4 years ago

Multiple Mitigations Per Threshold

Those readers who’ve used our alerting system know that it’s based on alert policies that are each made up of one or more thresholds that enter alarm state when triggered by user-defined conditions. Alarms generate notifications (email, Slack, PagerDuty, etc.) but they can also automatically initiate mitigation. With our latest iteration, you can now assign more than one mitigation per threshold.


What’s the advantage of multiple mitigations per threshold? Below are a few simple examples of why this feature is so useful:

  • You can now use a single policy to configure all of the desired mitigation methods/platforms with which you’d like to respond to a given set of conditions, which is much more scalable than cloning a given policy for each of your appliances so that they can all trigger at the same time for a given condition.
  • Users with mitigation appliances at multiple sites now have the ability to trigger them all at the same time.
  • The response for a given alarm can now include a mix of mitigation types, e.g. RTBH, A10, and Radware. A multi-location DDoS response involving multiple mitigations types is outlined in the following example:
    1. De-preference or stop announcing a BGP route on Location #1 by injecting a route whose community has been predefined as a flag for these actions.
    2. Announce a broader routing table entry, less-specific than /24 (thus forcing acceptance by Internet peers), for Location #2.
    3. Trigger a 3rd-party mitigation method — e.g. A10 or Radware — on Location #2 to announce more specific prefixes for internal re-direction to a scrubbing center.

mitigations-600w.png
To add a second mitigation to an existing policy, head over to Alerting » Policies and click on the name of the policy. In the Edit Policy dialog click the Alert Thresholds tab and scroll down to the Mitigations section. In the drop-down Add Mitigation menu, select the appropriate mitigation platform and click the Add Mitigation button.

For more information about using mitigation, check out our KB article on Alert Mitigation.

Avatar of authorJoe Reves