
May 2017 Update
nProbe Hosts and NPM v2
nProbe is agent software from ntop that is used to get traffic data from hosts to Kentik Detect. Kentik’s integration with nProbe has undergone significant improvement with newer versions (7.5 or higher). We’ve summarized some key points about the upgrades below; you can also learn more about the changes in the following Knowledge Base topics:
- Installing and running nProbe on a host: Host Configuration.
- Newly available metrics and dimensions: Host Metrics and Dimensions.
Selecting Host Devices
nProbe hosts are selected like any other devices in the device selector in the Devices pane of the Data Explorer (shown at right). nProbe hosts of v7.5 or higher are represented with the device type icon that is labeled “DNS WWW.”

New Metrics for NPM
nProbe-based deployments can now query on new Network Performance Monitoring (NPM) metrics (listed at right) in addition to the traditional metrics available from non-host devices (e.g. routers and switches).

Native Data Format
nProbe now communicates natively with the Kentik Detect platform, which means that there’s no need to use the Kentik Proxy Agent (chfagent) for hosts, even in private IP deployments. nProbe now sends traffic data to Kentik Detect using kFlow, Kentik’s own enriched and encrypted flow format.
New Host-specific Dimensions
Users running the new nProbe version are now able to query on host-based, application-level group-by dimensions. The initial set of new dimensions, which are related to DNS and WWW, are listed at right. These dimensions are available in the Group-By Dimension selector whenever any selected device is a host (see above).

Grouping by Substrings
Depending on the specific host dimensions selected to group by, a cut function for DNS/WWW dimensions will be available in the “Advanced Options” section of the Query Pane. This feature allows grouping by regex-matched substrings. In practice this means that you can dynamically pull results for metrics that are broken down by specific string patterns within those dimensions, such as TLD, domain name, specific HTTP Query arguments, or subsets of User Agent strings.
As an example, the graph and table below were generated using the DNS Query group-by dimension on an nProbe host:
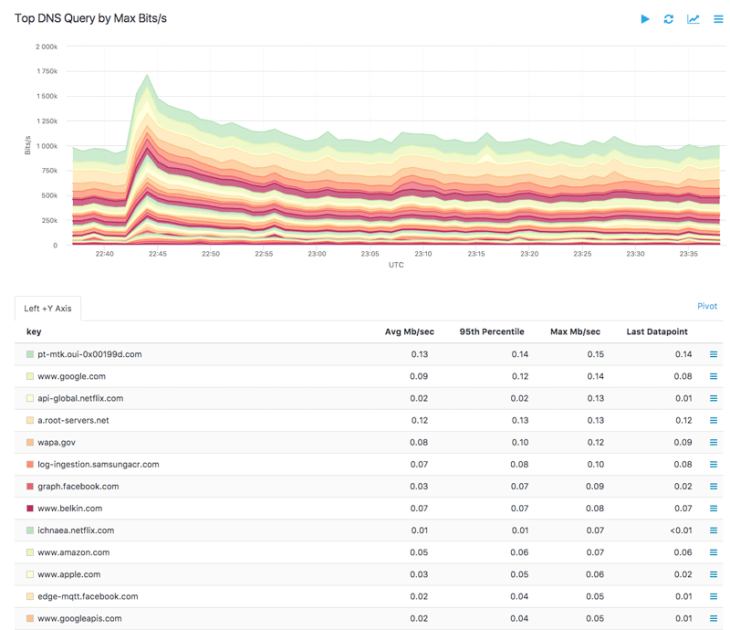
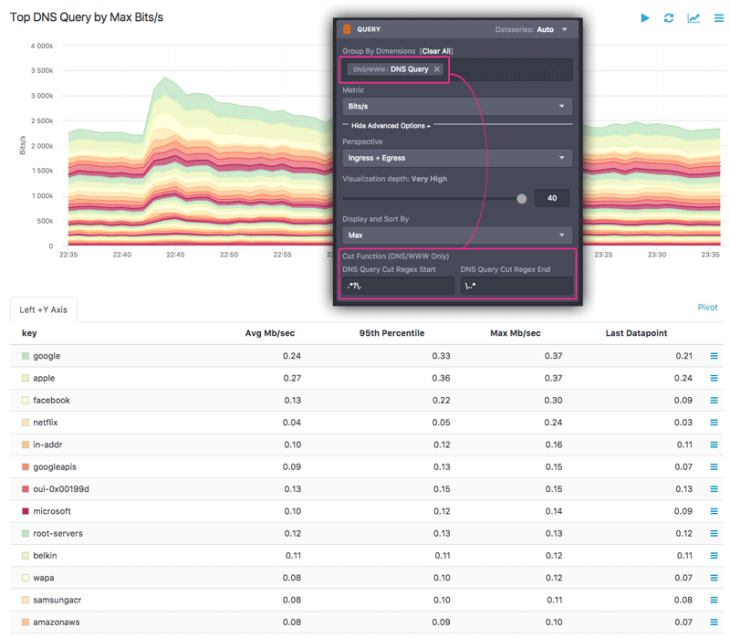
Using the DNS cut function, this query can be refined to group by domains, with the result shown below:
Access Control Lists
In our constant effort to increase security around access to your critical data, we have just added the Access Control (aka ACL) feature. Access control, which is covered in the Access Control article in our Knowledge Base, is configurable through Kentik Detect Portal at Admin » Access Control menu:
What ACLs offer is the ability to filter, by IP address or subnet, access to four different subsystems of Kentik Detect:
- Portal: controls access via the Kentik Detect portal.
- API: controls access via Kentik APIs.
- Agent: controls access via the Kentik Proxy Agent.
- Database: controls access via a PostgreSQL client.
Two options are available for each individual interface:
- “Allow All” (default setting for Portal and Agent).
- “Deny All except,” which enables you to whitelist individual IPs/CIDRS (default for API and Database).

Data Explorer additions
Unique Count of Source and Destination IPs
The technique for calculating unique source and destination IP counts over multiple selected devices has been updated for improved accuracy. We used to compute the #unique destination IPs for each selected device, for each 1-minute time bucket, then return the max per-device count of IPs within the specified time range. We now get a more realistic result by computing the number of unique destination IPs for the union of all selected devices, and then take the max corresponding to the specified time range.
New metric: Unique Destination next-hop ASNs
With this new metric you’ll be able to count the number of unique Next-Hop ASNs for a given device. This can be useful to track the number of peers you have on a specific Internet Exchange, as shown below.

Bi-directional Filters
We’ve noticed that when doing our own spelunking in Kentik Detect we often look up flows against a given ASN or IP/CIDR regardless of whether it’s a destination or a source. That used to require two filters, which could add up to a lot of extra work when stacking filters to narrow a query. So, as shown below, we’ve now provided a whole additional column in the Filter selector with dimensions that match source OR destination. Dimensions with this convenience include Country, ASN, AS Name, Flow Tag, IP Port, Mac Address, IP/CIDR, Interface ID, Interface Name, Interface Description and Route Prefix.

SNMPv3 Polling
We’ve added SNMPv3 to the existing SNMP v2c methods for automated polling of meta-data on your devices. SNMPv3 is a more secure iteration of SNMP and is preferable when your SNMP information will travel over the open Internet (i.e. when you are not directly peered with Kentik’s AS).
SNMPv3 adds two layers of security to the v1 and v2c model: authentication and privacy (a.k.a. encryption).
When configuring a device, you can now enable SNMPv3 by turning on the toggle.
Both can be individually enabled and configured in the SNMP section of the device page:
- Authentication: Both MD5 and SHA methods are supported.

- Privacy (encryption): Only 56-bit DES is supported for encryption (AES or 3DES are not currently supported).
Alerting Updates
Slack Notifications Channels
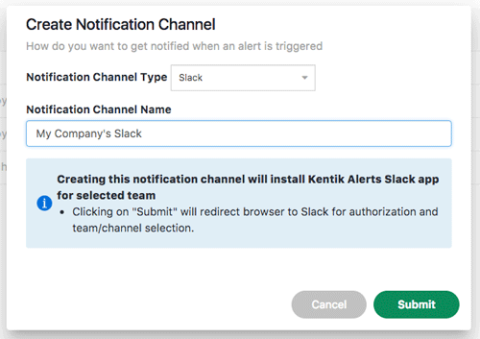
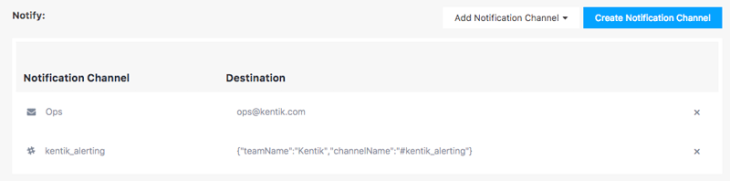
Our Alerting system is gaining output capabilities as we move to enable more seamless integration with your internal workflows. In addition to email, syslog, and JSON, we’ve now added Slack notifications to our range of available Alerting Notification Channels. Check it out at Alerting » Notification Channels, where you can now create a Slack notification channel
After you set configurations in a series of Slack web pages where you select your Slack Team and the channels to post in, this newly created Notification Channel is then available for use in the thresholds of your Alert Policies.
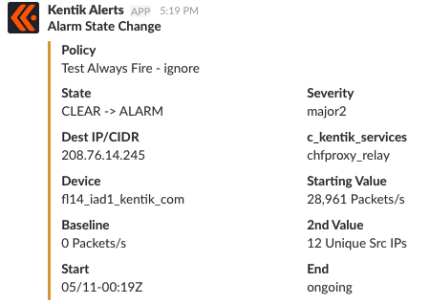
The below example shows a Kentik alert notification in Slack:
Weekend-aware baselining
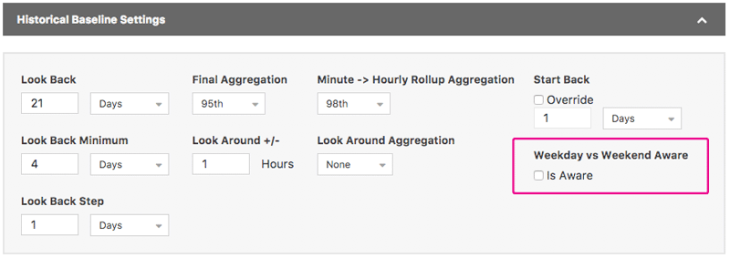
Baseline settings in an Alert Policy now include a “Weekend Aware” option (shown below). When active, this setting takes into account the day on which traffic will be evaluated against the baseline:
- If evaluated over the weekend (Saturday, Sunday), only weekend days in the look-back period will be considered.
- If evaluated over a weekday, weekend days will be discarded from the loopback.
This option can be a life-saver for situations like content networks, where there is a lot of traffic over the weekend and much less traffic on weekdays. Without taking the day of week into account, weekend traffic could set off false positives for alerts that track unusually high traffic.
Miscellaneous Alerting Updates
Additional improvements to Alerting:
- Bi-directional filters (see above): available in alerting too!
- Packet–Size: now available in Alert Policies, a both:
– a Dimension to use for Group-By;
– a Filter to include or exclude specific packet sizes. - View in Explorer:
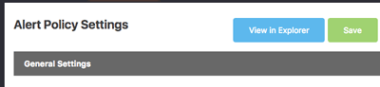 a button on Alert Policy page that allows you to look at the existing, current flow data against which you are trying to build a policy.
BGP Events Notifications
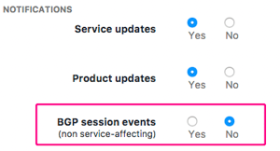
You asked for it: we’ve added a notification toggle for BGP events to the notification setting on the User Profile, which is accessible by clicking your username at the top right of the navbar.
With this setting toggled to “Yes” you will be informed via email of any BGP event on Kentik Detect’s ingest points, including all service-affecting issues. We will continue to notify about BGP-affecting maintenance windows via our usual channels.
